
Web traffic spikes 38% in the first half of November. But Cyber Five traffic falls 13%. Black Friday sees 3x the traffic of a normal October day. Data centers and bots make their mark. Discover the trends and statistics 1.7 billion online visits reveal about the global 2022 holiday season. And get 4 key takeaways for online retailers to prepare for 2023 holiday shopping.
In the 2021 Holiday Season, ecommerce web traffic grew a massive 57% year-over-year (YoY).
But with inflation surging and a return to brick-and-mortar shopping, the question on every online retailer’s mind was: can these numbers repeat themselves in 2022?
At Queue-it we tracked 1.7 billion visitors across 65 retailers worldwide from Nov. 1 to Dec. 21, 2022, to get the answers to this question and more. Discover the key holiday shopping traffic insights and stats you need to understand consumer behavior and prepare for the 2023 Holiday Season.
Queue-it provides a virtual waiting room solution that helps retailers prevent website crashes and control traffic surges to their websites and apps. Although visitors only see a waiting room page when a website or app experiences traffic overload, Queue-it has insight into all traffic requests while the virtual waiting room is in place.
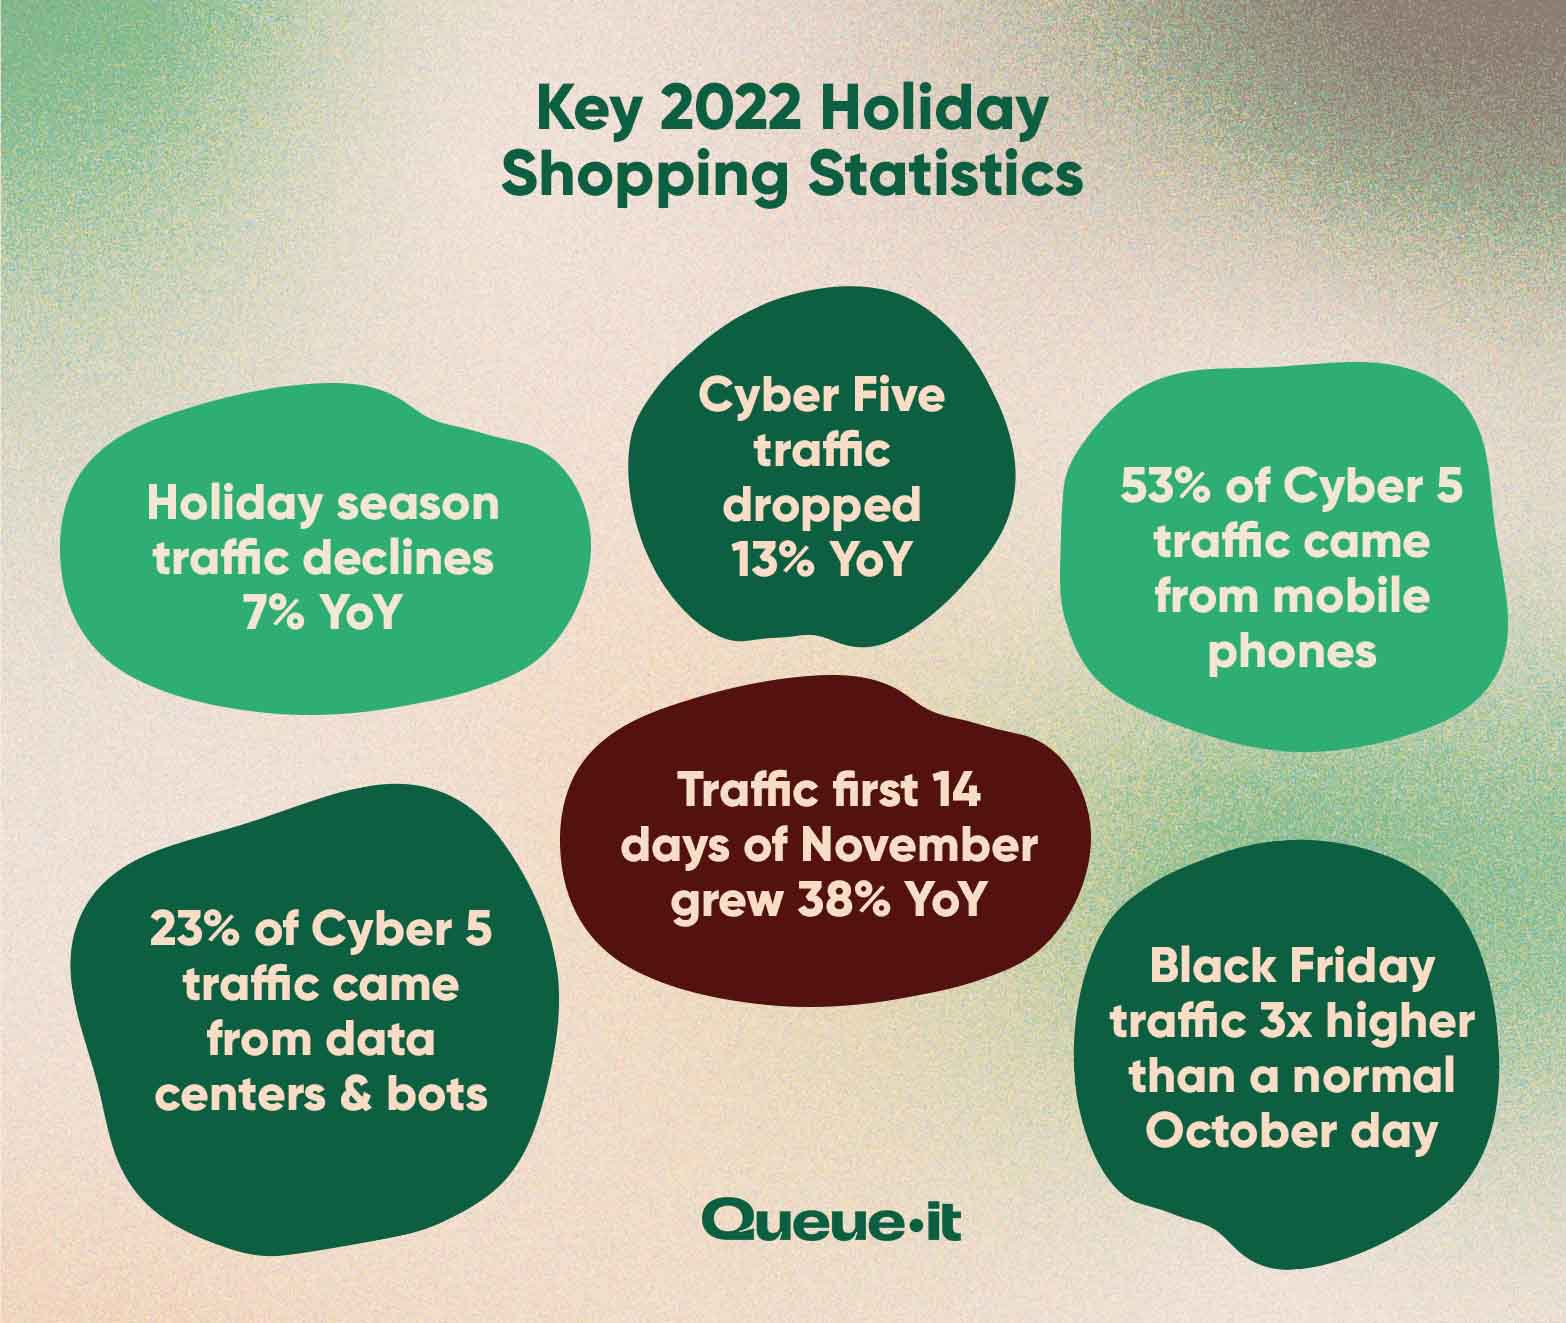
Here are the 8 key Holiday Season shopping statistics and insights and 4 key takeaways you need to know from 1.7 billion visitors to prepare for the 2023 shopping season.
Note: All YoY comparisons are normalized for a changed retail sample, unless otherwise indicated.
Table of contents
1. Holiday Season online retail traffic declined 7% YoY
2. Holiday shopping consumer behavior: shopping started earlier than ever
3. Cyber Five still dominates holiday shopping traffic
4. Black Friday remains biggest day: Traffic 3x regular October shopping day
5. Early access sales drive Thanksgiving traffic rush
6. Holiday Season demand for electronics surges
7. 53% of Cyber Five retail traffic comes from mobile
8. Bot & data center traffic accounts for up to 23% of Cyber Five total
9. Retail traffic trends: 4 takeaways for online retailers
The 2022 Holiday Season saw the first YoY online traffic decline since Queue-it’s annual traffic reports started in 2020.
Online retail traffic over the Holiday Season (Nov. 1 to Dec. 21) was 7% lower in 2022 than 2021.
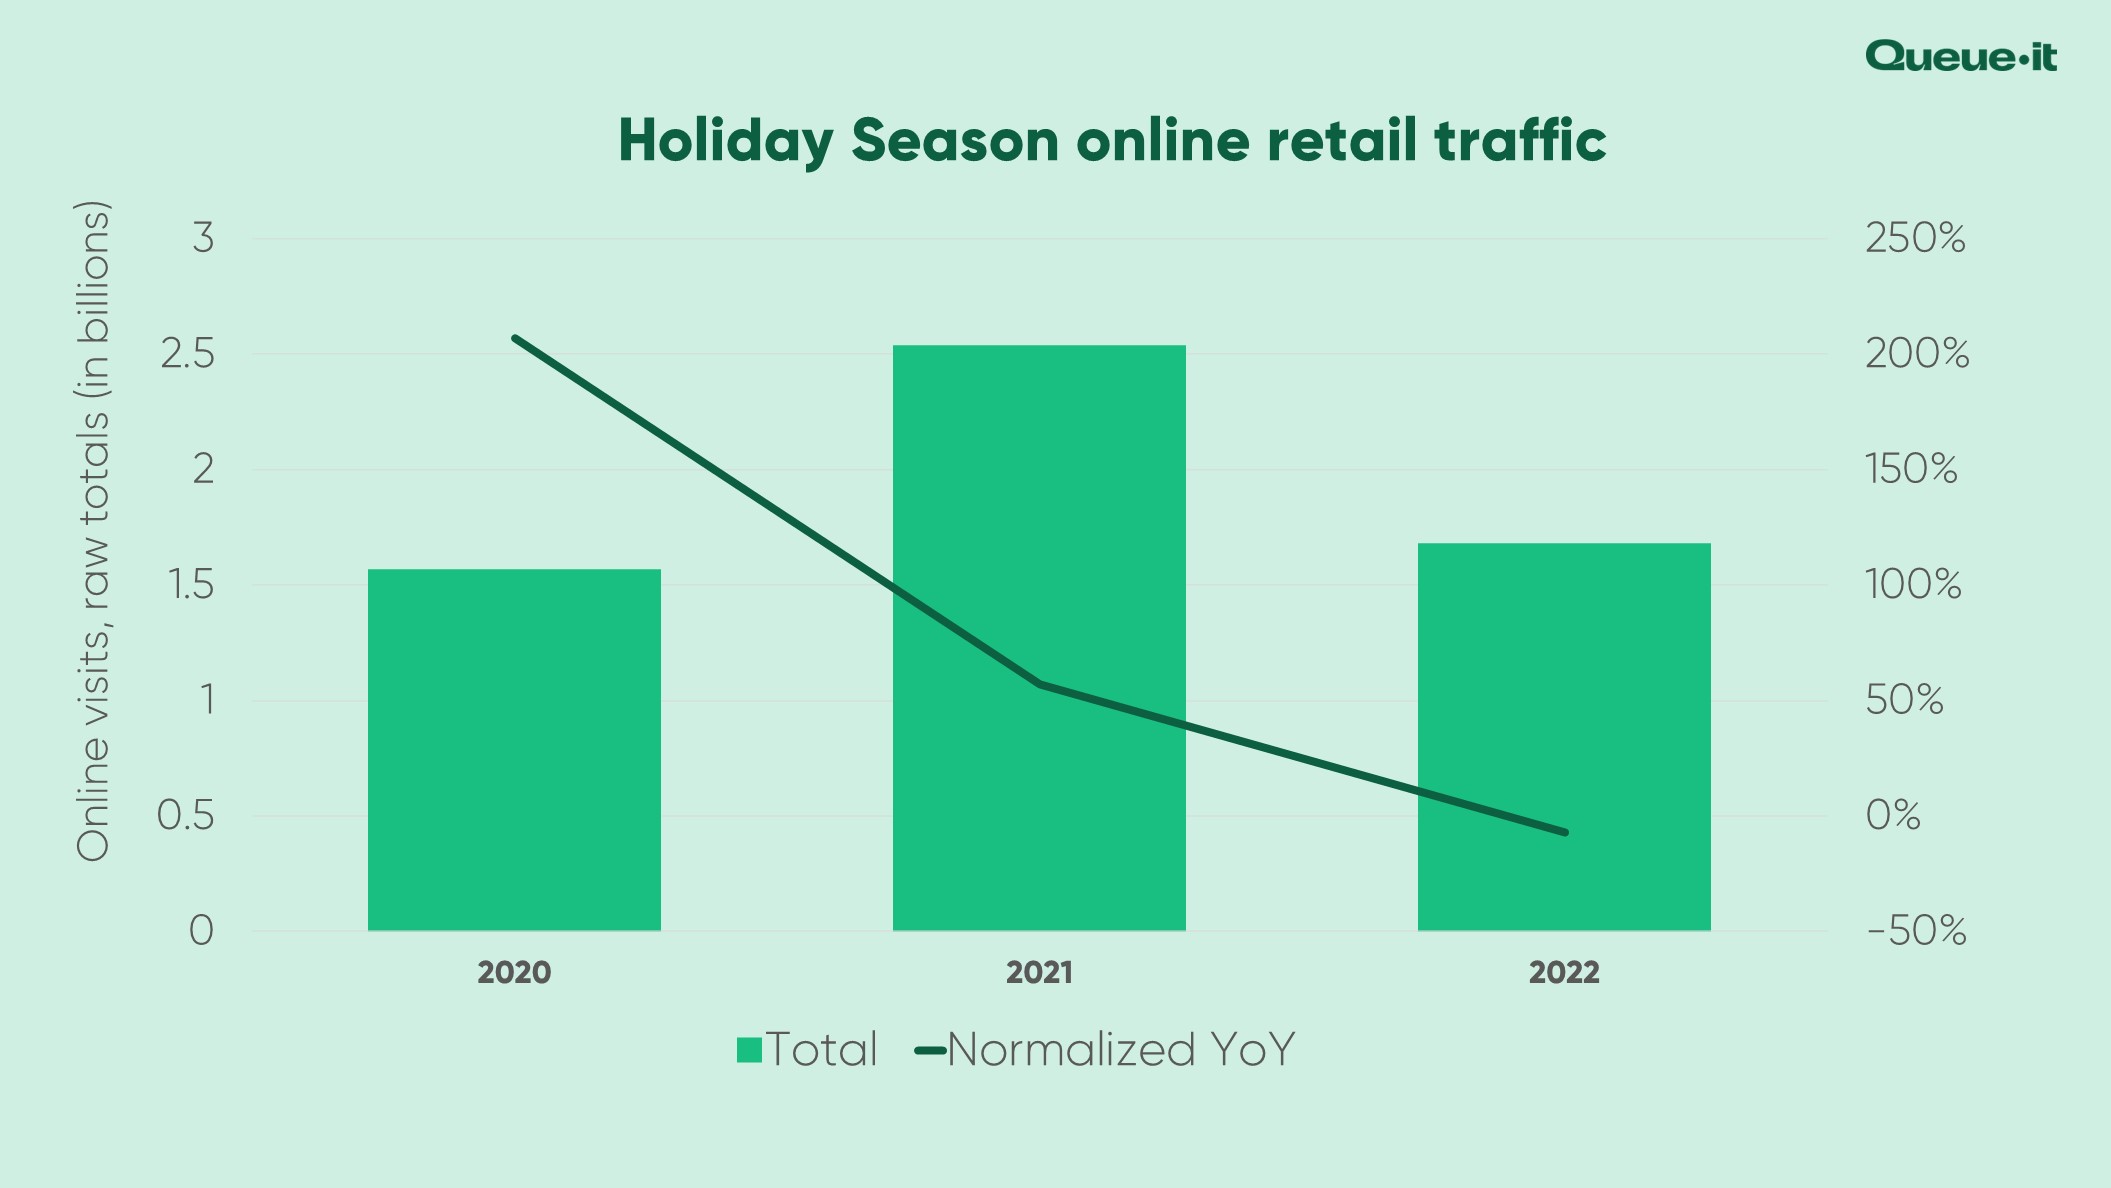
Despite this decline, Holiday Season traffic remained highly elevated compared to normal months. The average day across the Holiday Season period (Nov 1 – Dec 21) sees 1.5x traffic compared to the average September or October day.
The overall traffic decline may come as a surprise to retailers who’ve seen headlines about a 1.7% YoY increase in online spending in November 2022. But this number, from Adobe, isn’t adjusted for inflation.
Adjusting Adobe’s findings to match the 8.3% YoY increase in the U.S. consumer price index brings these numbers largely in line with the 7% decrease in online traffic Queue-it observed in 2022.
Surveys, spending data, and traffic data alike all suggest rising costs and economic uncertainty made their mark this Holiday Season:
- 47% of consumers said rising costs would significantly impact their holiday shopping.
- 28% of consumers planned to spend less this Holiday Season than last.
- 34% of consumers started shopping earlier to spread out the cost of the holidays.
But, before we jump to conclusions about ecommerce reaching peak market penetration, it’s worth remembering that this slight 2022 decline in Holiday Season traffic comes after two years of unprecedented ecommerce growth.
Ecommerce traffic increased 207% YoY in 2020. In 2021, it jumped another 57%.
The 2022 Holiday Season is likely just a minor correction in ecommerce growth after a two-year boom.
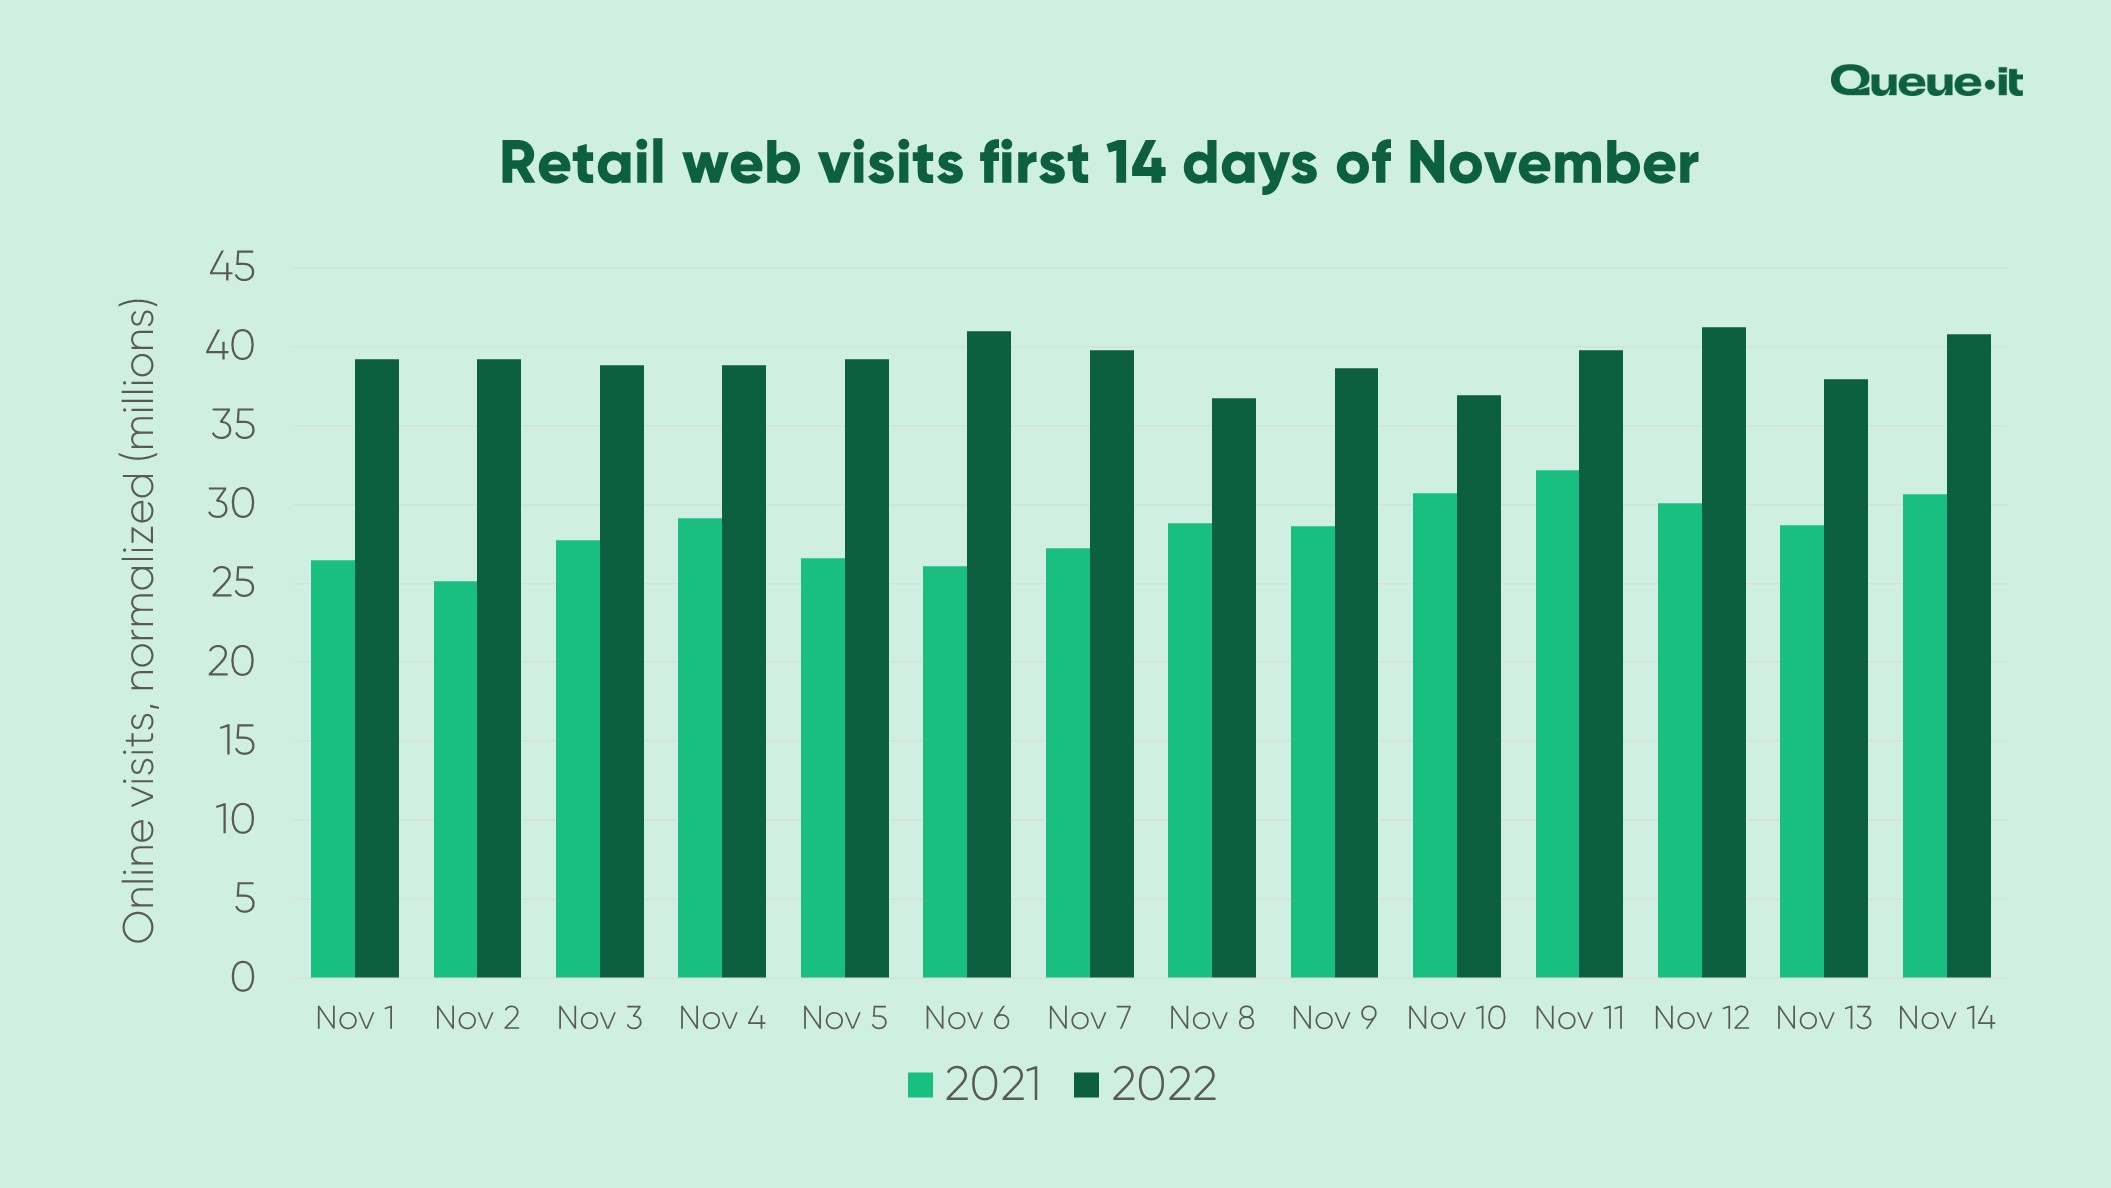
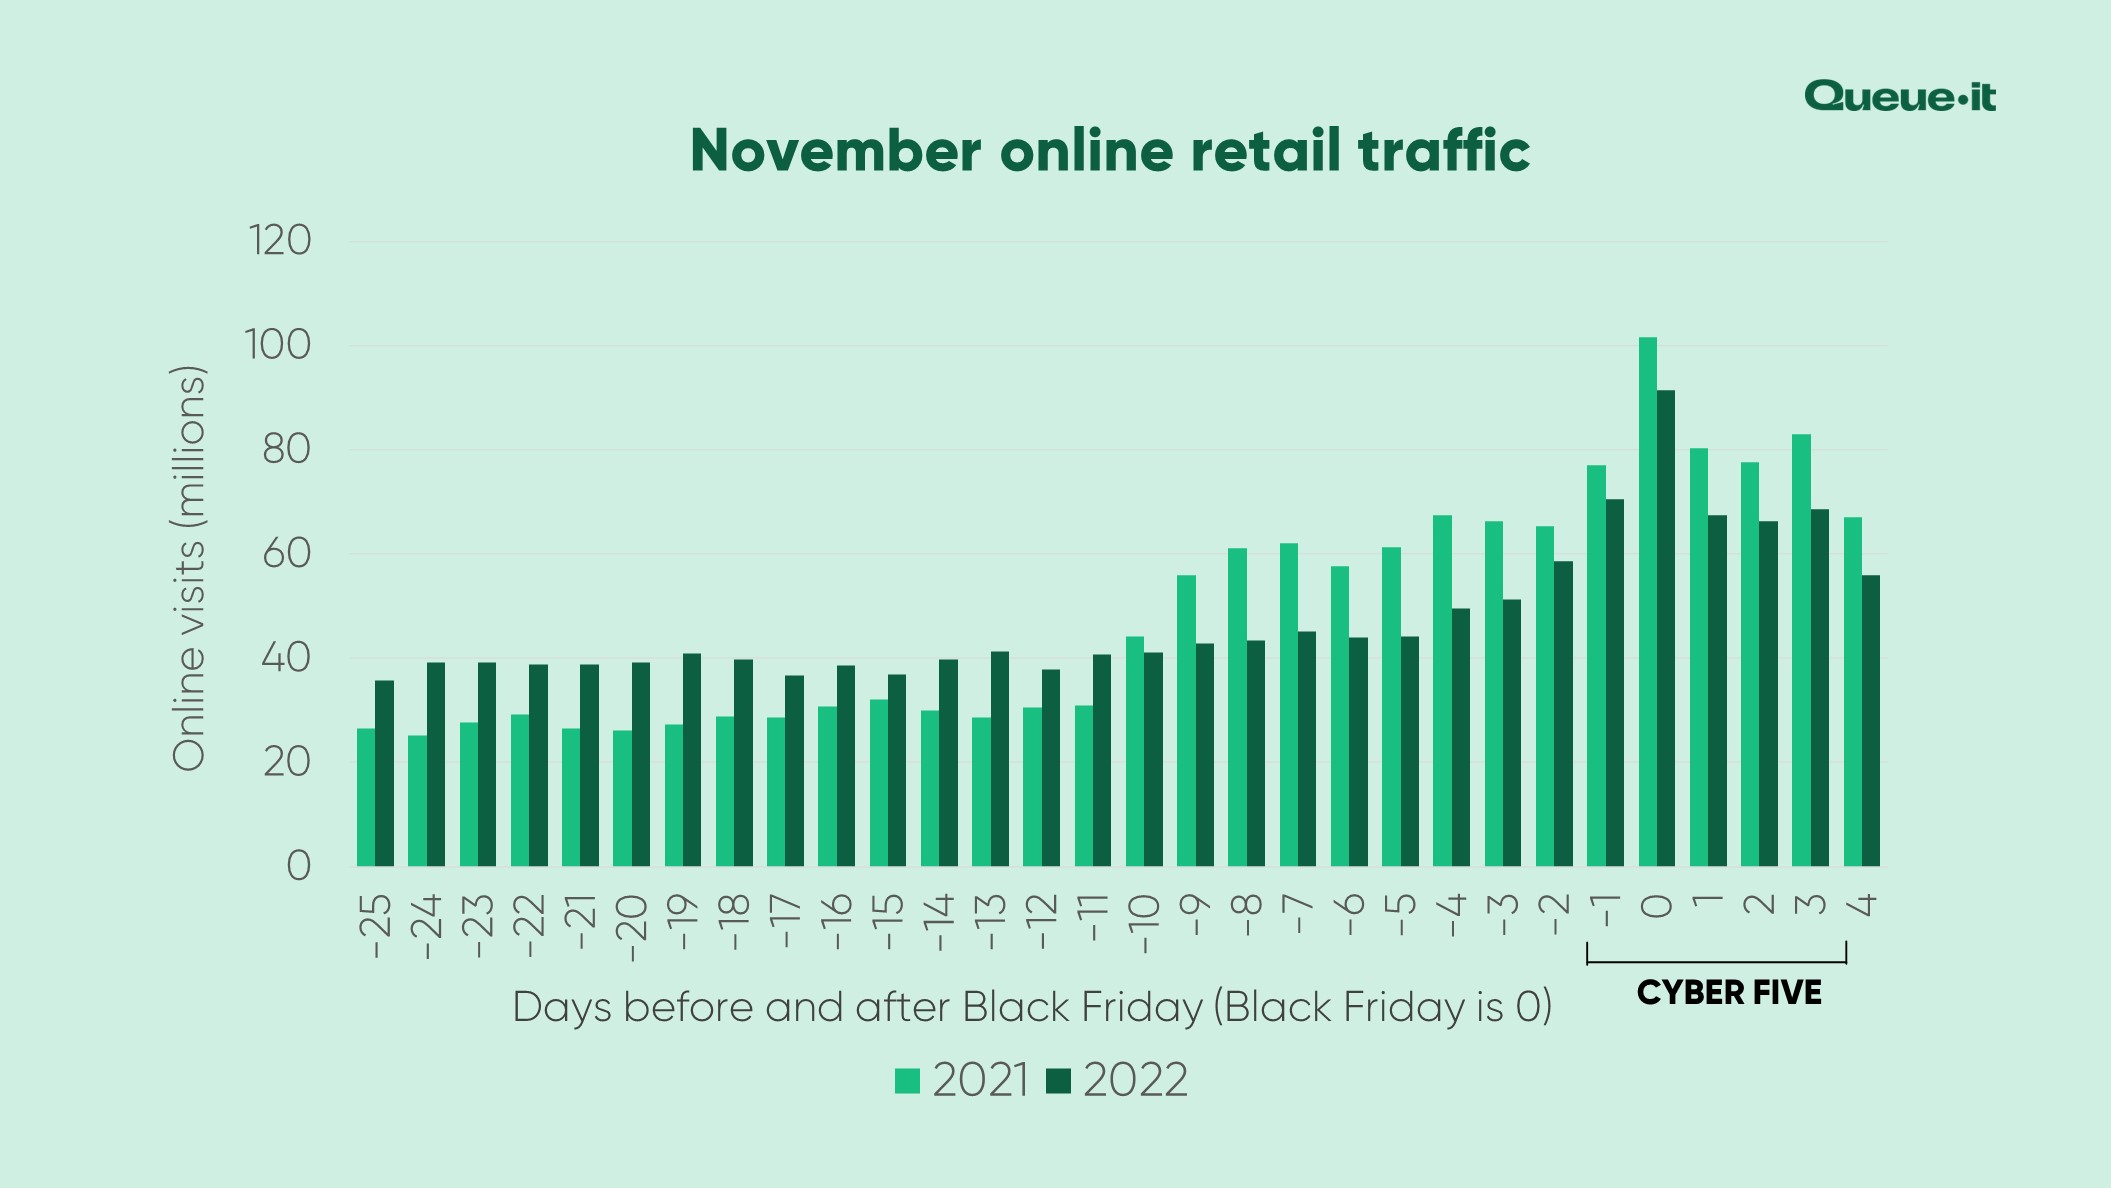
While the overall Holiday Season traffic levels were down, traffic at the start of November saw a massive surge.
The first 7 days of November saw traffic 47% higher in 2022 than last year.
And the first 14 days of November were up 38% YoY.
This push towards earlier Holiday Season shopping has been happening for years now.
But while last year it was attributed to supply chain shortages and concerns about COVID-19, 2022 demonstrates that the longer Holiday Season is an ongoing consumer trend.
Major retail players are pushing Holiday Season shopping earlier and earlier, and consumers are enjoying the peace of mind that comes with being prepared, and not spending their whole Holiday Season budgets in a day.
It’s worth noting, however, that this is traffic data, not spending data. So, these earlier spikes may result from shoppers browsing stores and exploring deals without buying online.
Conversion rates are typically higher across Cyber Five (Thanksgiving through to Cyber Monday) than on regular days. And surveys show 81% of consumers research products online before heading to stores, stressing the importance of omnichannel.
Whether this higher online traffic represents higher online spend or not, it highlights the importance of visibility and marketing early in the Holiday Season.
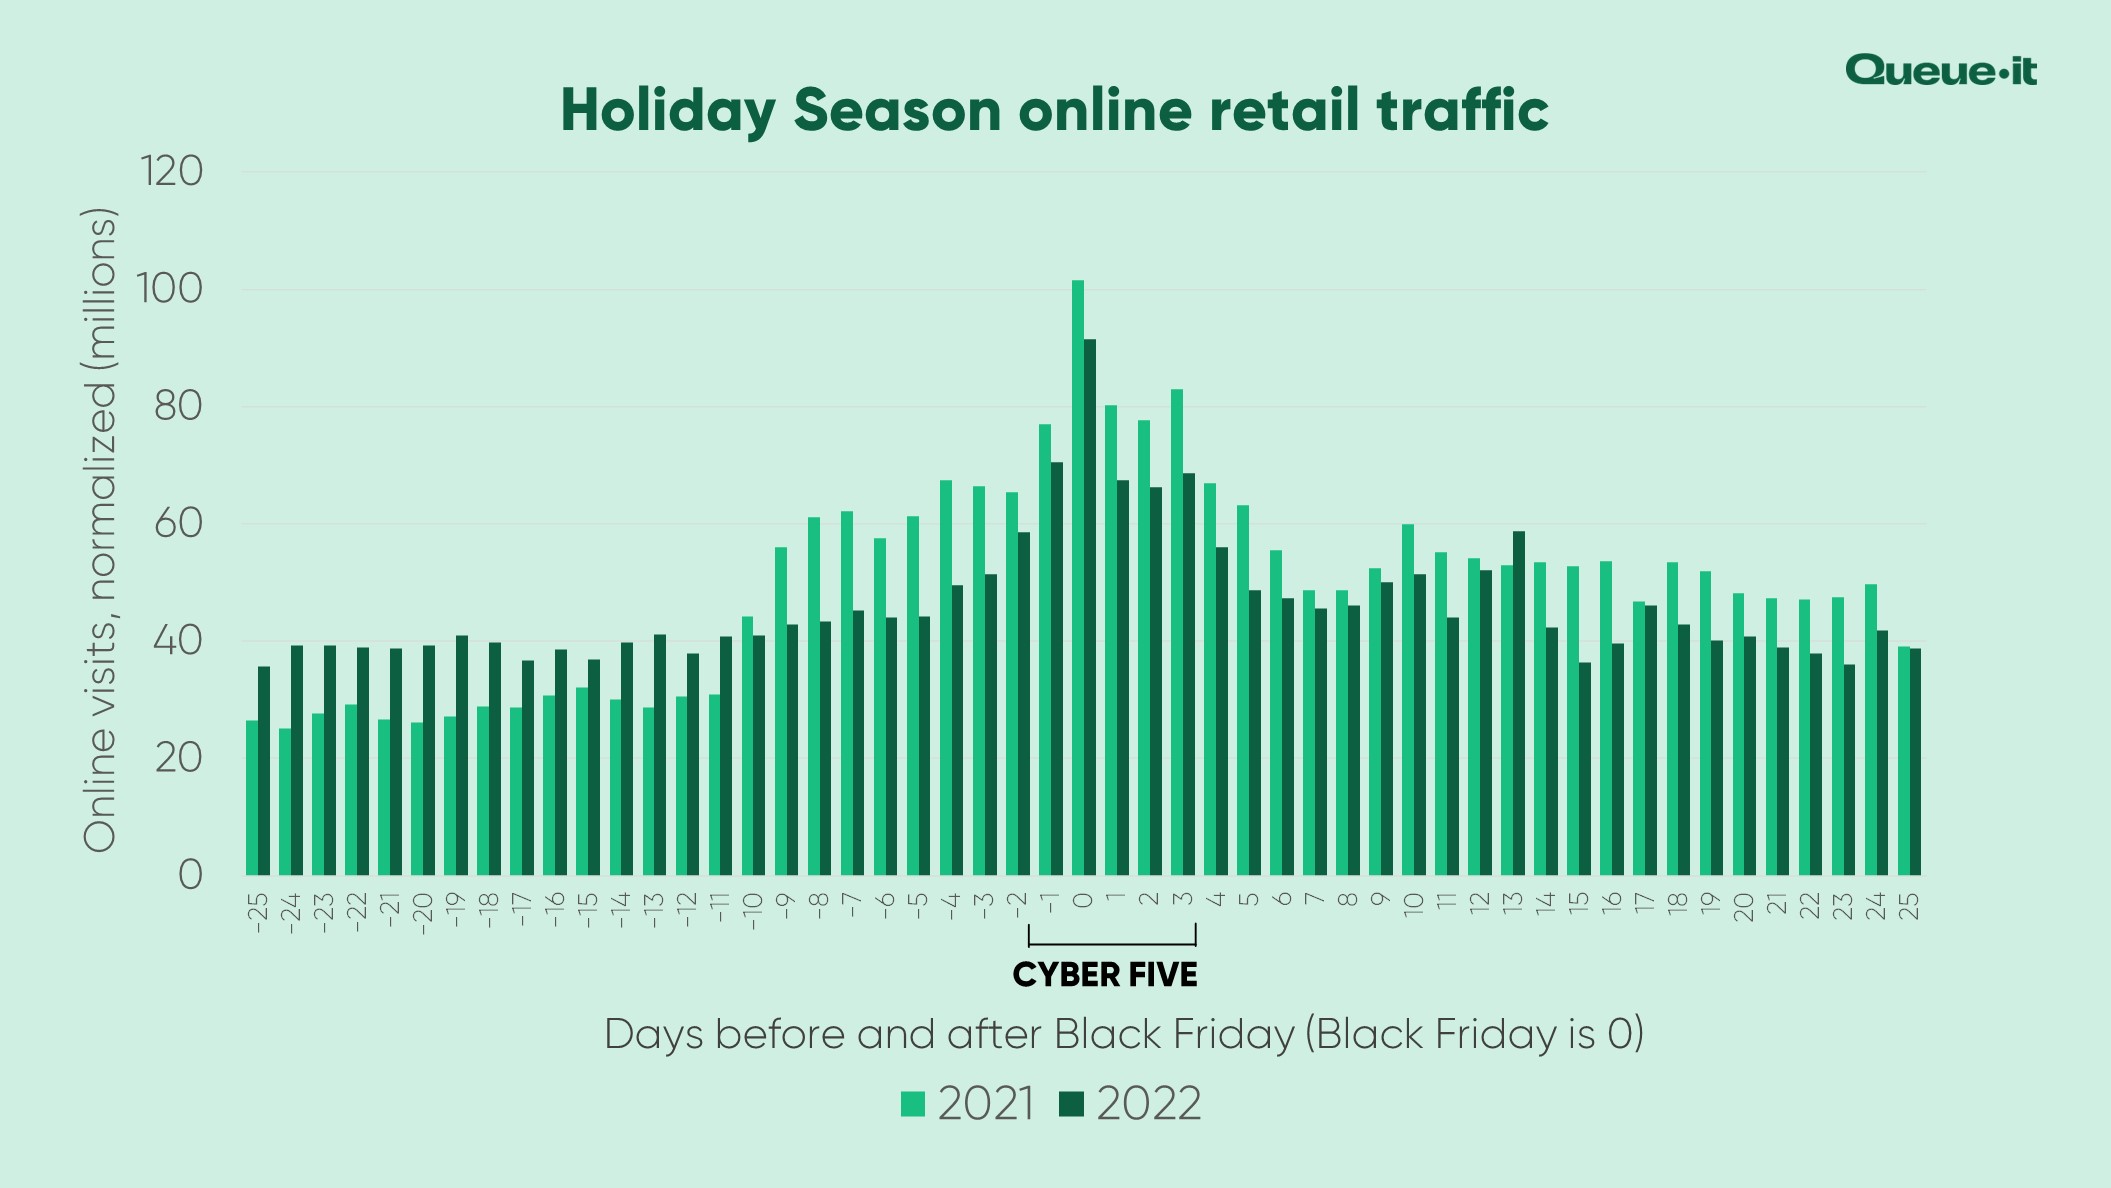
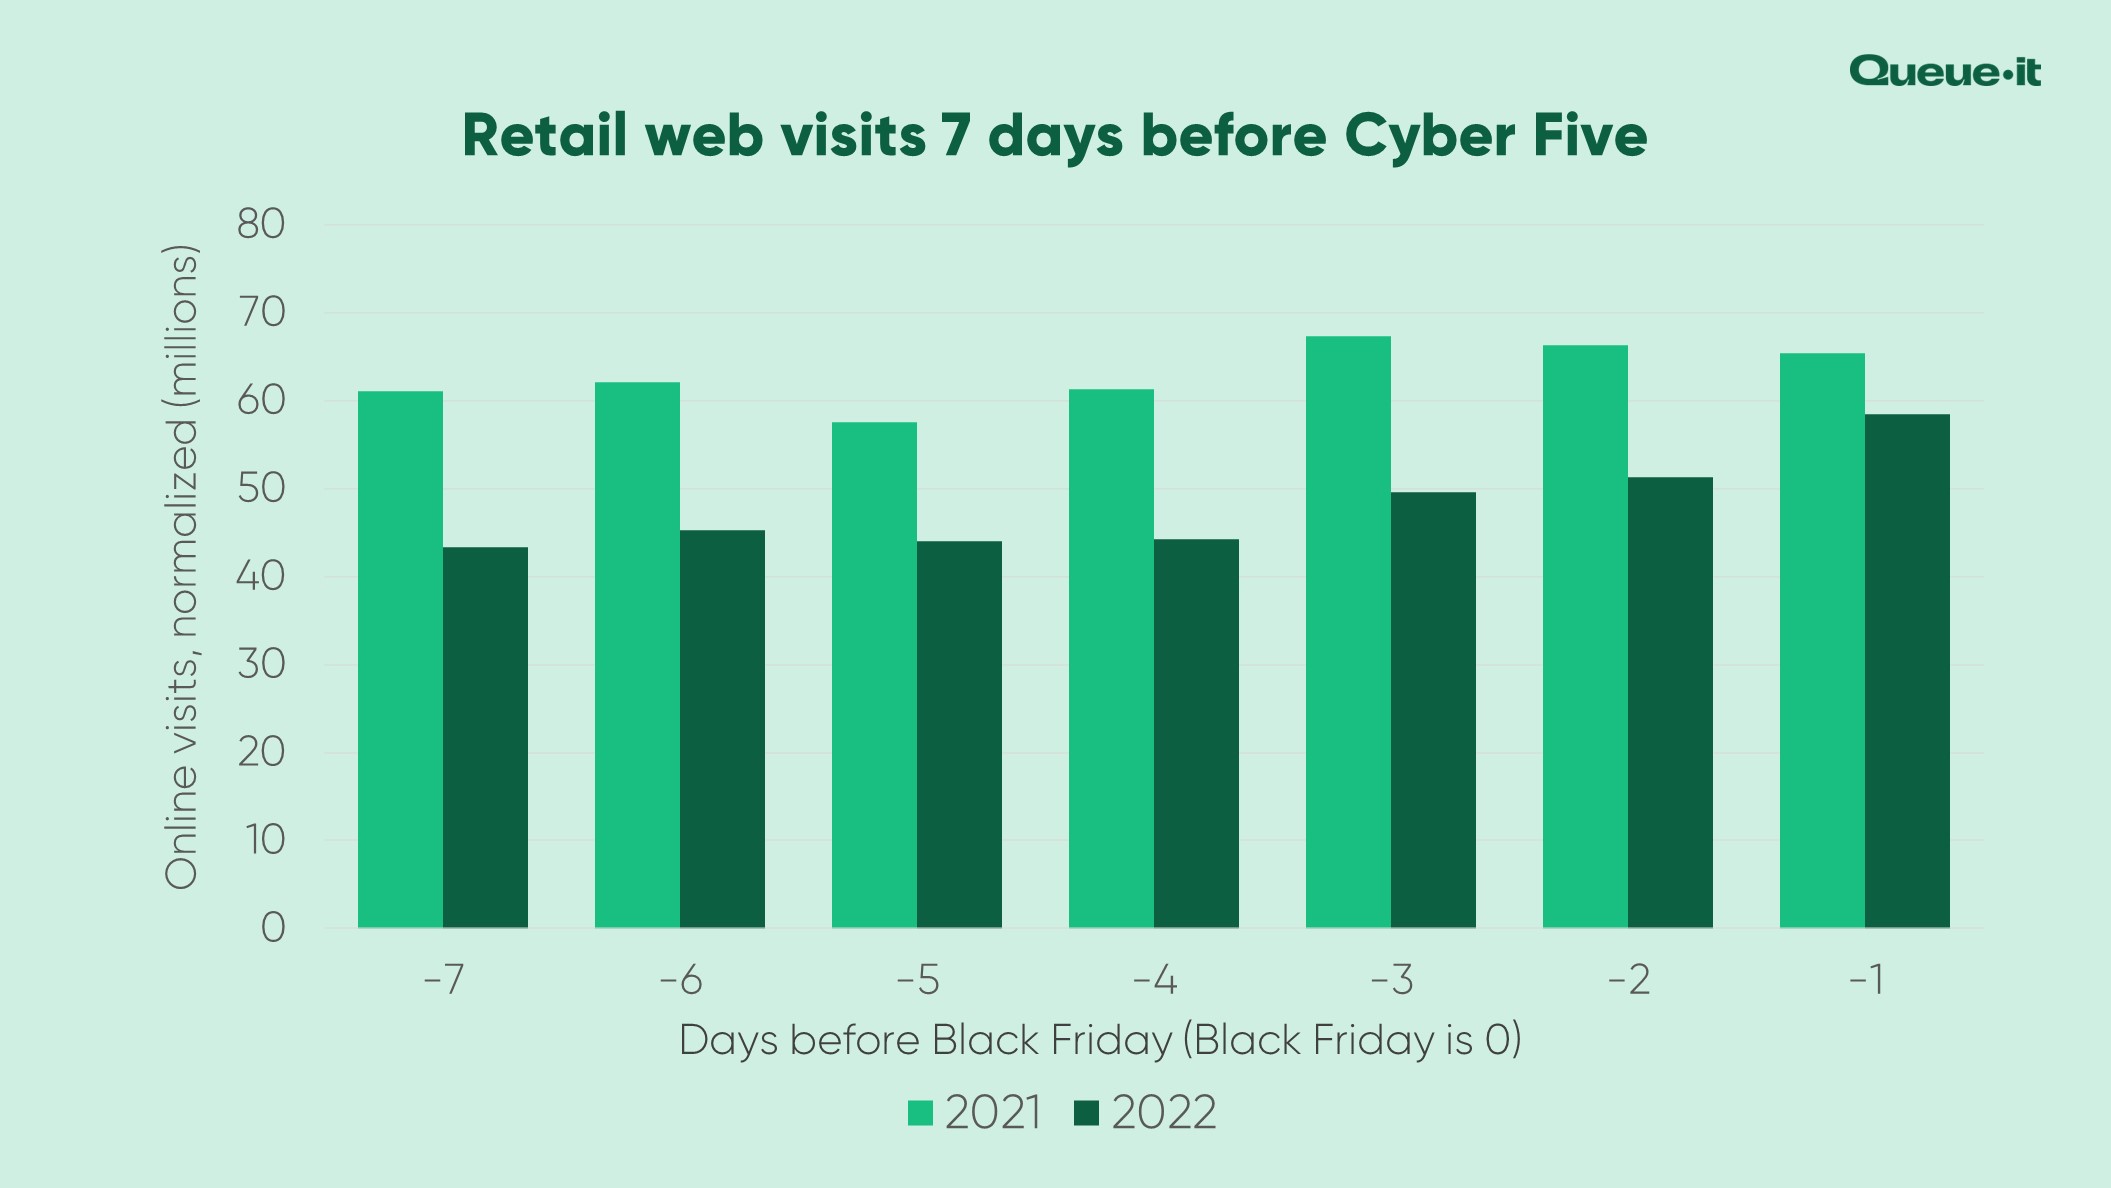
The traffic spike early in November had downstream effects on traffic throughout the Holiday Season. Where last year we saw traffic spike a full 7 days before Cyber Five, this year the week prior to Cyber Five was much more muted.
As the chart below shows, traffic was higher last year for every single day in the 7 days leading up to Cyber Five.
The 7 days prior to Cyber Five saw traffic decline 23% YoY. This stands in stark contrast to the first week of November, when 2022 traffic levels were almost 1.5x that of 2021.
Despite the longer Holiday Season, Cyber Five’s massive traffic peaks still dominated our Holiday Season data. Thanksgiving to Cyber Monday remained anything but normal days for online retailers in 2022.
In fact, just over a quarter of all November web visits occurred across Cyber Five.
Reflecting the higher traffic distribution in 2022, though, that number is down from 29% in 2021.
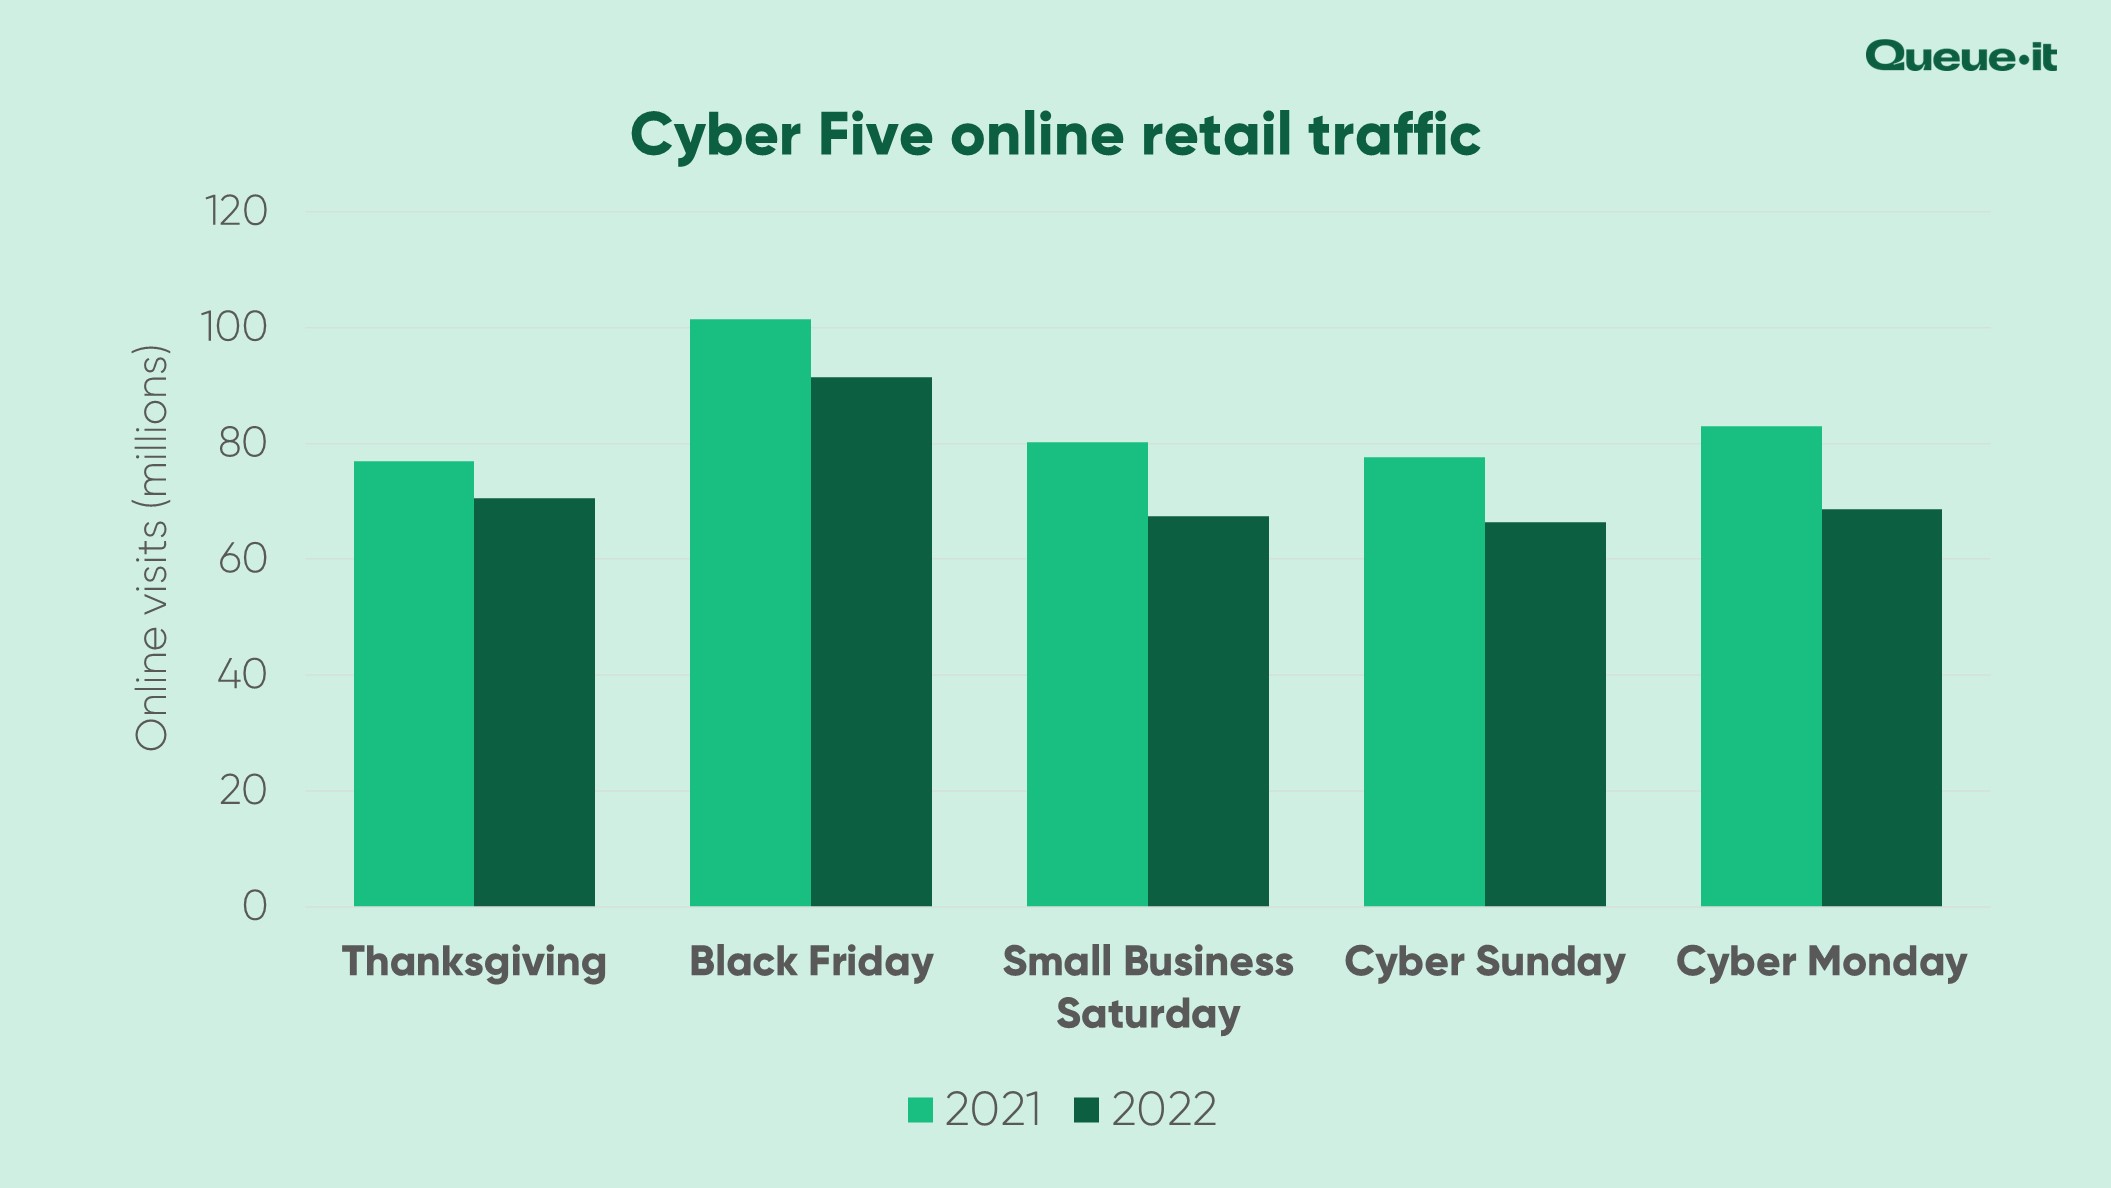
Cyber Five web traffic overall declined 13% compared to 2021.
Here’s the Cyber Five YoY change breakdown:
- Thanksgiving: -8.4%
- Black Friday: -10%
- Small Business Saturday: -15.8%
- Cyber Sunday: -14.5%
- Cyber Monday: -17.3%
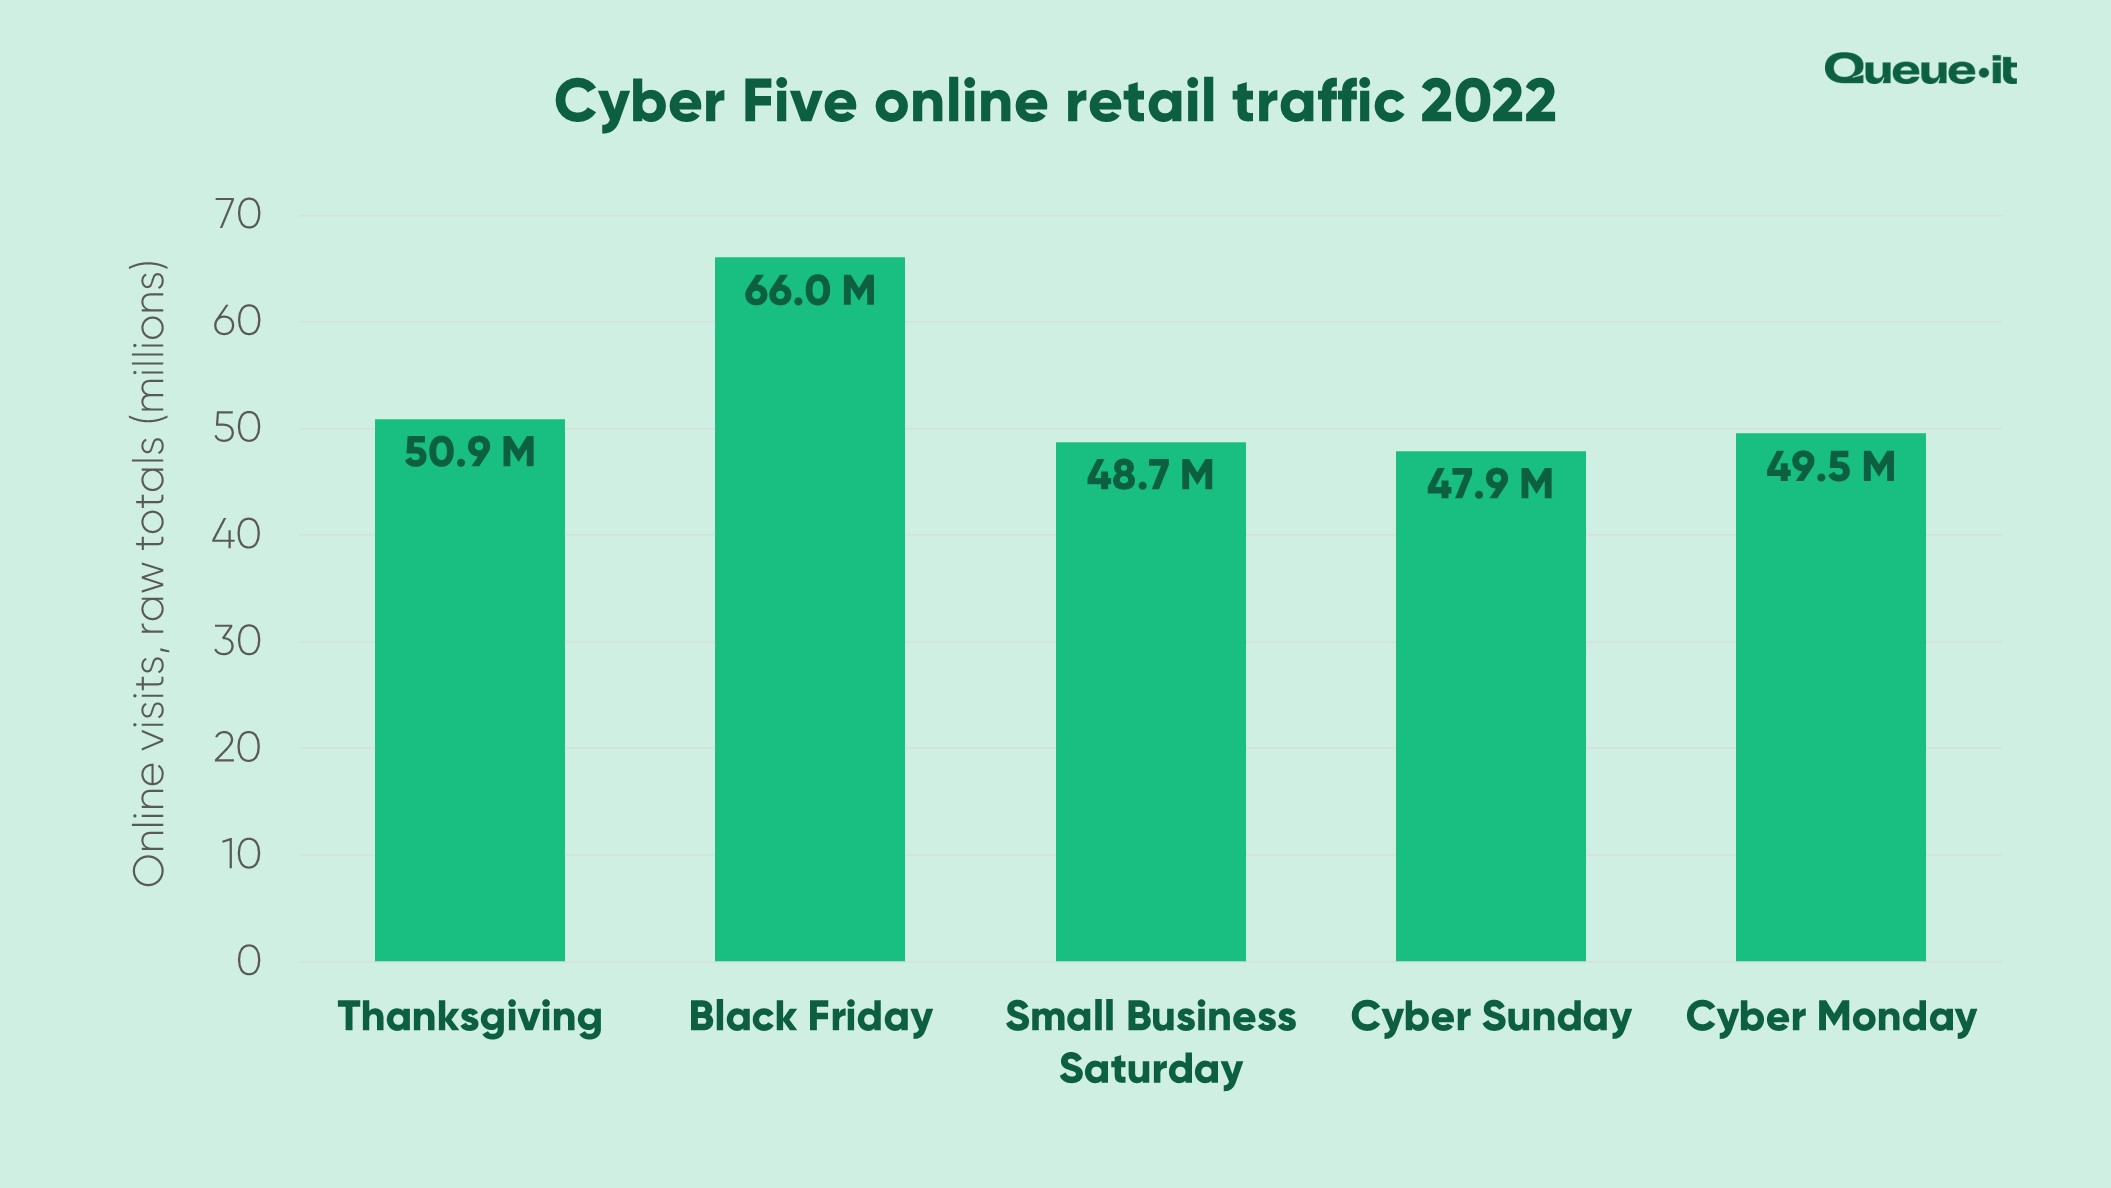
For the third year in a row, Black Friday was retail’s biggest day in terms of online traffic.
In raw numbers, we tracked 66 million web visits on Black Friday. That’s 3x (295%) traffic on an average day in October.
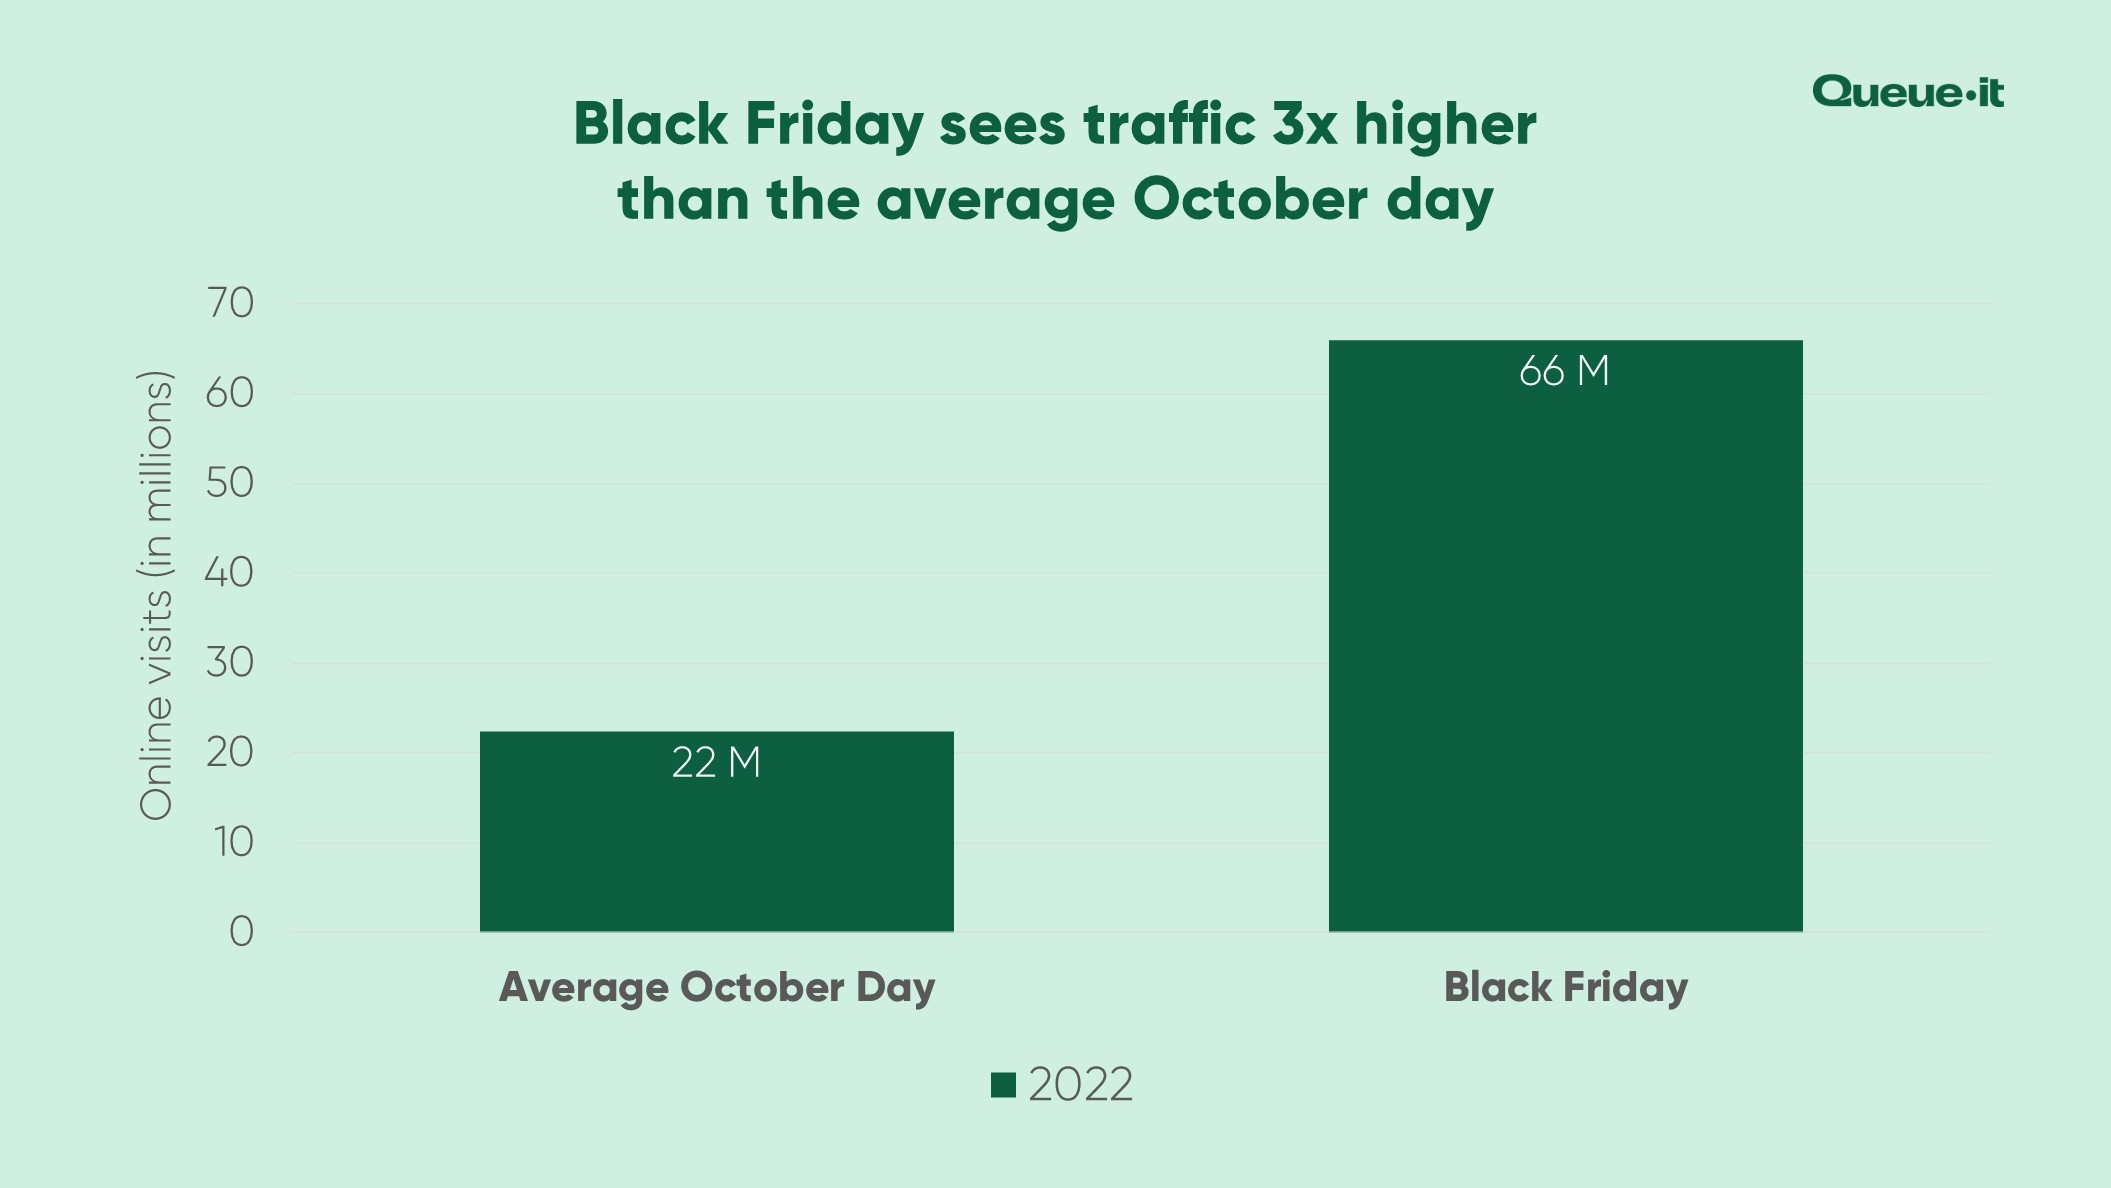
Black Friday traffic levels were more than double that of each of the first 20 days of November. They were also 30% higher than the second biggest day of the year (Thanksgiving).
While this all sounds impressive, traffic to online retail sites on Black Friday actually fell 10% YoY.
This is likely because of the larger traffic spikes earlier in the month—people have already done the bulk of their shopping—and a continued sign that the Holiday Season is no longer confined to one (or even five) big days.
Discover how you can break Black Friday sales records without breaking your site

While Cyber Monday made headlines this year for being the largest single retail spend day in U.S. history, in our global sample Cyber Monday wasn’t even the second biggest day of Cyber Five.
Thanksgiving (or “the day before Black Friday”, as it’s known by most outside of the U.S.), saw the second largest traffic peak of the year, with almost 51 million web visits (in raw numbers).
Cyber Monday had 49.5 million visits, so the two were neck-and-neck for the Holiday Season’s silver medal.
Awareness of Cyber Monday outside of the U.S. is significantly lower than that of Black Friday. Surveys across Europe, the Middle East, and Latin America, consistently find that Black Friday remains the more well-known shopping holiday internationally.
Traffic across Cyber Five was consistently lower than last year, but Thanksgiving traffic had the smallest decrease out of the five. Thanksgiving declined 8.4% YoY, compared to Cyber Monday’s 17.3% decline.
But why Thanksgiving? Why would that be the second biggest day?
Two words: early access.
The past couple of years have seen ecommerce brands place a huge emphasis on loyalty programs and newsletter subscriptions. And early access is consistently among the key value props to encourage sign-ups and subscriptions.
Amazon, in particular, applied the Holiday Season pressure to online retailers this year. Not only did they run their usual Prime Day deals in July, but they also ran a second Prime Early Access Sale in October and a 48-hour “Black Friday” sale that started on Thanksgiving.
Other major retail players from Walmart to Target to Best Buy also ran early access deals for loyalty program members.
Retailers hoping to compete with these retail behemoths were forced to push deals and offers earlier.
So, it’s not so much that Thanksgiving is a big international holiday shopping day, it’s just that it’s the day before Black Friday, and customers flocked to retail sites for exclusive early access to Black Friday deals.
RELATED: Roll Out the Red Carpet for VIP Customer with Exclusive, Invite-only Sales & Drops
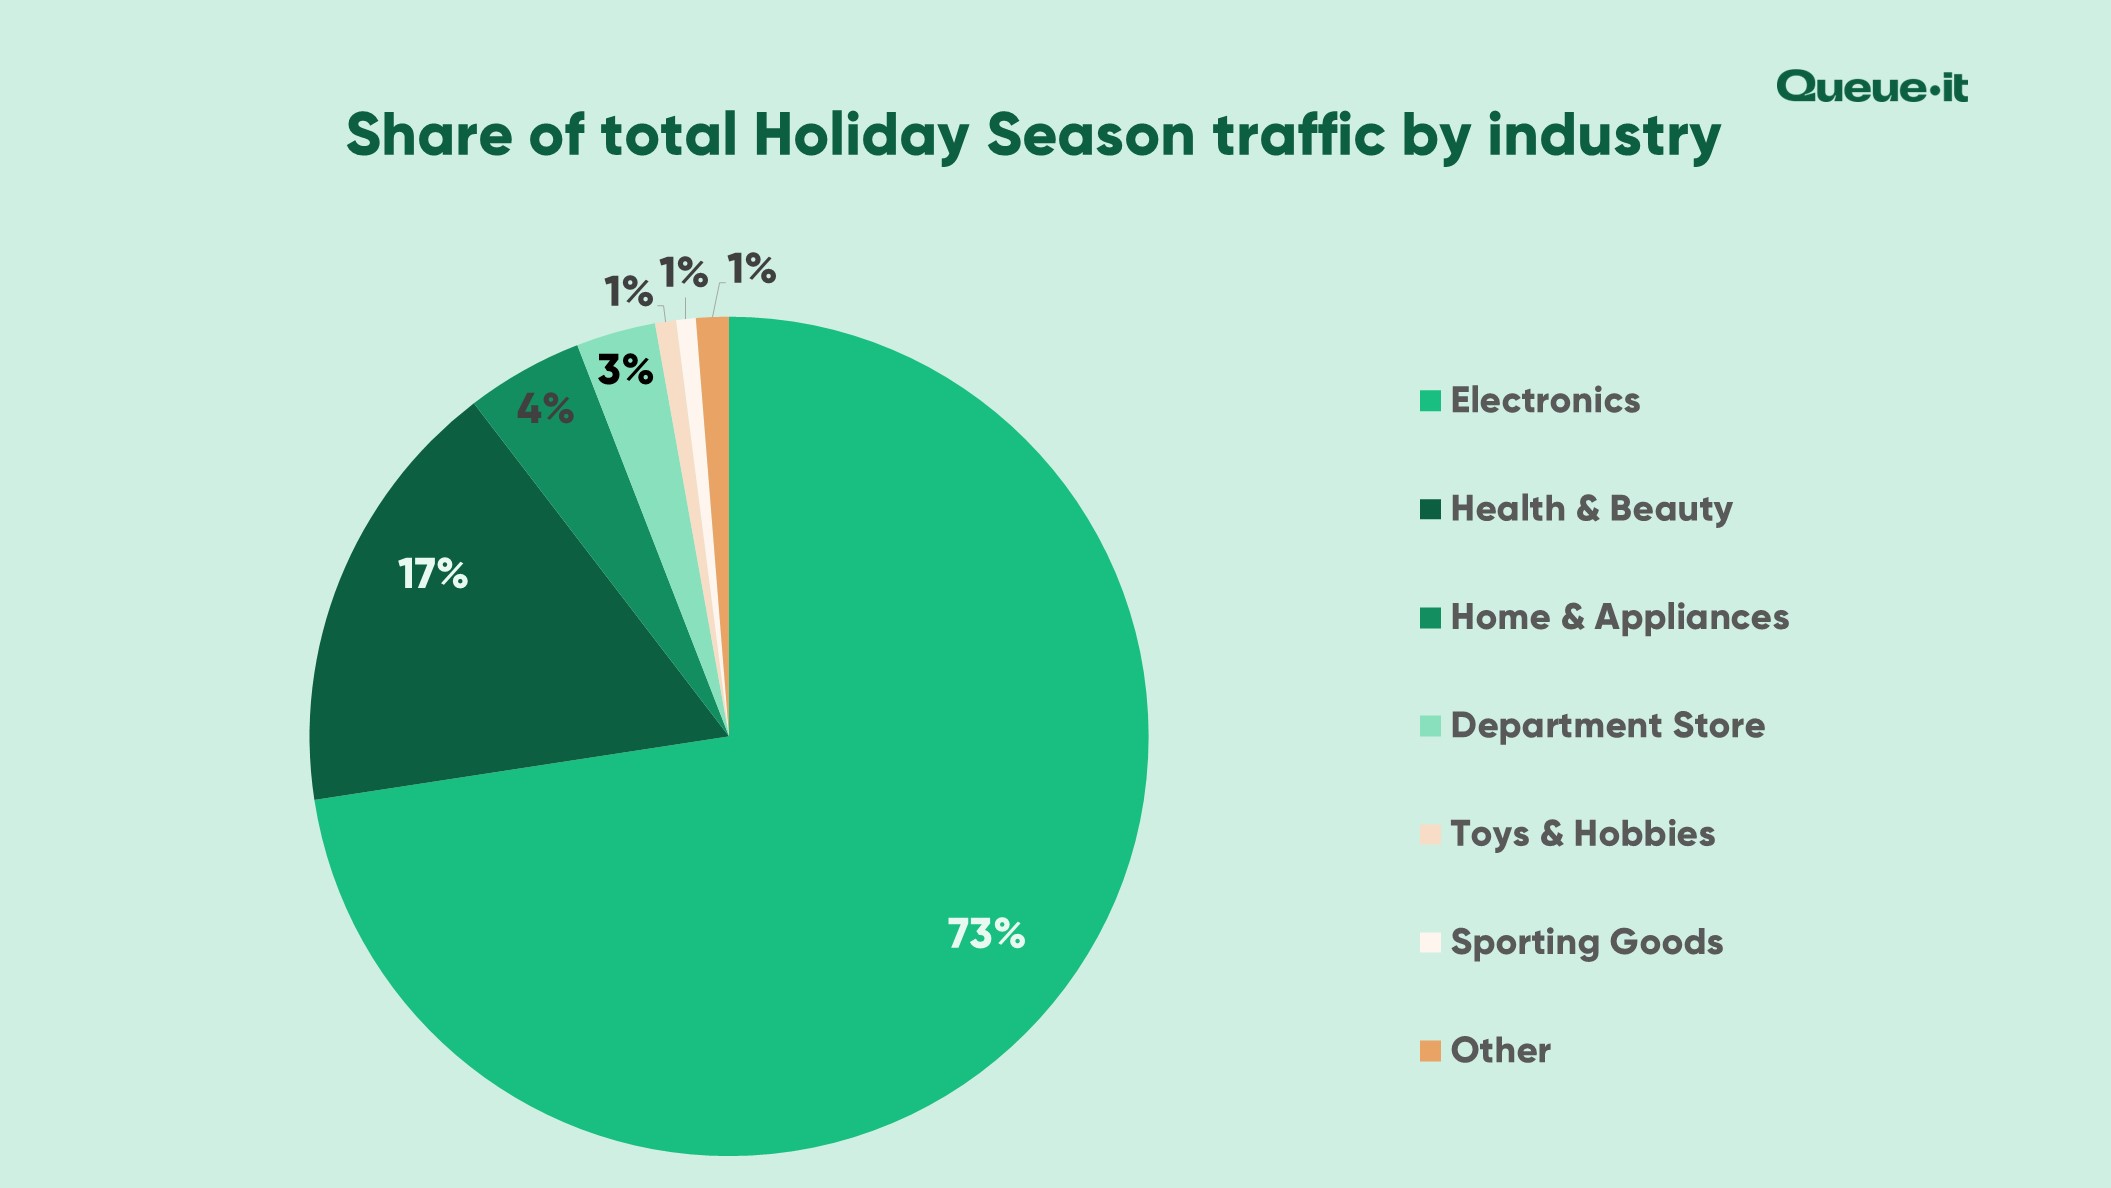
For the third year in a row, electronics retailers saw the largest share of Holiday Season web traffic, accounting for 72% of total traffic.
This is up from 30% in 2020 and 54% in 2021.
Health & beauty was the second largest category, accounting for 17% of total traffic.
The rising demand for electronics is reflected in data from Salesforce, which saw a 19% rise in sales for the category, as well as Adobe, which reported smart home items and audio equipment sales jumped by over 200% compared to an average October day.
Consumer tech is one of the fastest growing retail product categories, particularly across the Holiday Season, as it falls right after “Techtember” (the month Apple and other major tech brands typically announce new products) and is one of the few product categories that appeals to children and adults alike.
But the 2022 Holiday Season also saw the biggest discounts in 3 years for goods like computers, TVs, and appliances.
Adobe reports the best-selling electronics goods included gaming consoles, video games, MacBooks, drones, and smart watches.
In 2022, we launched Traffic Insights, a powerful analytics tool that gives customers a visual, actionable overview of waiting room traffic with accurate server-side analytics. Among other information, it’s allowed our customers to view the device breakdown of their visitors and flag suspicious traffic requests.
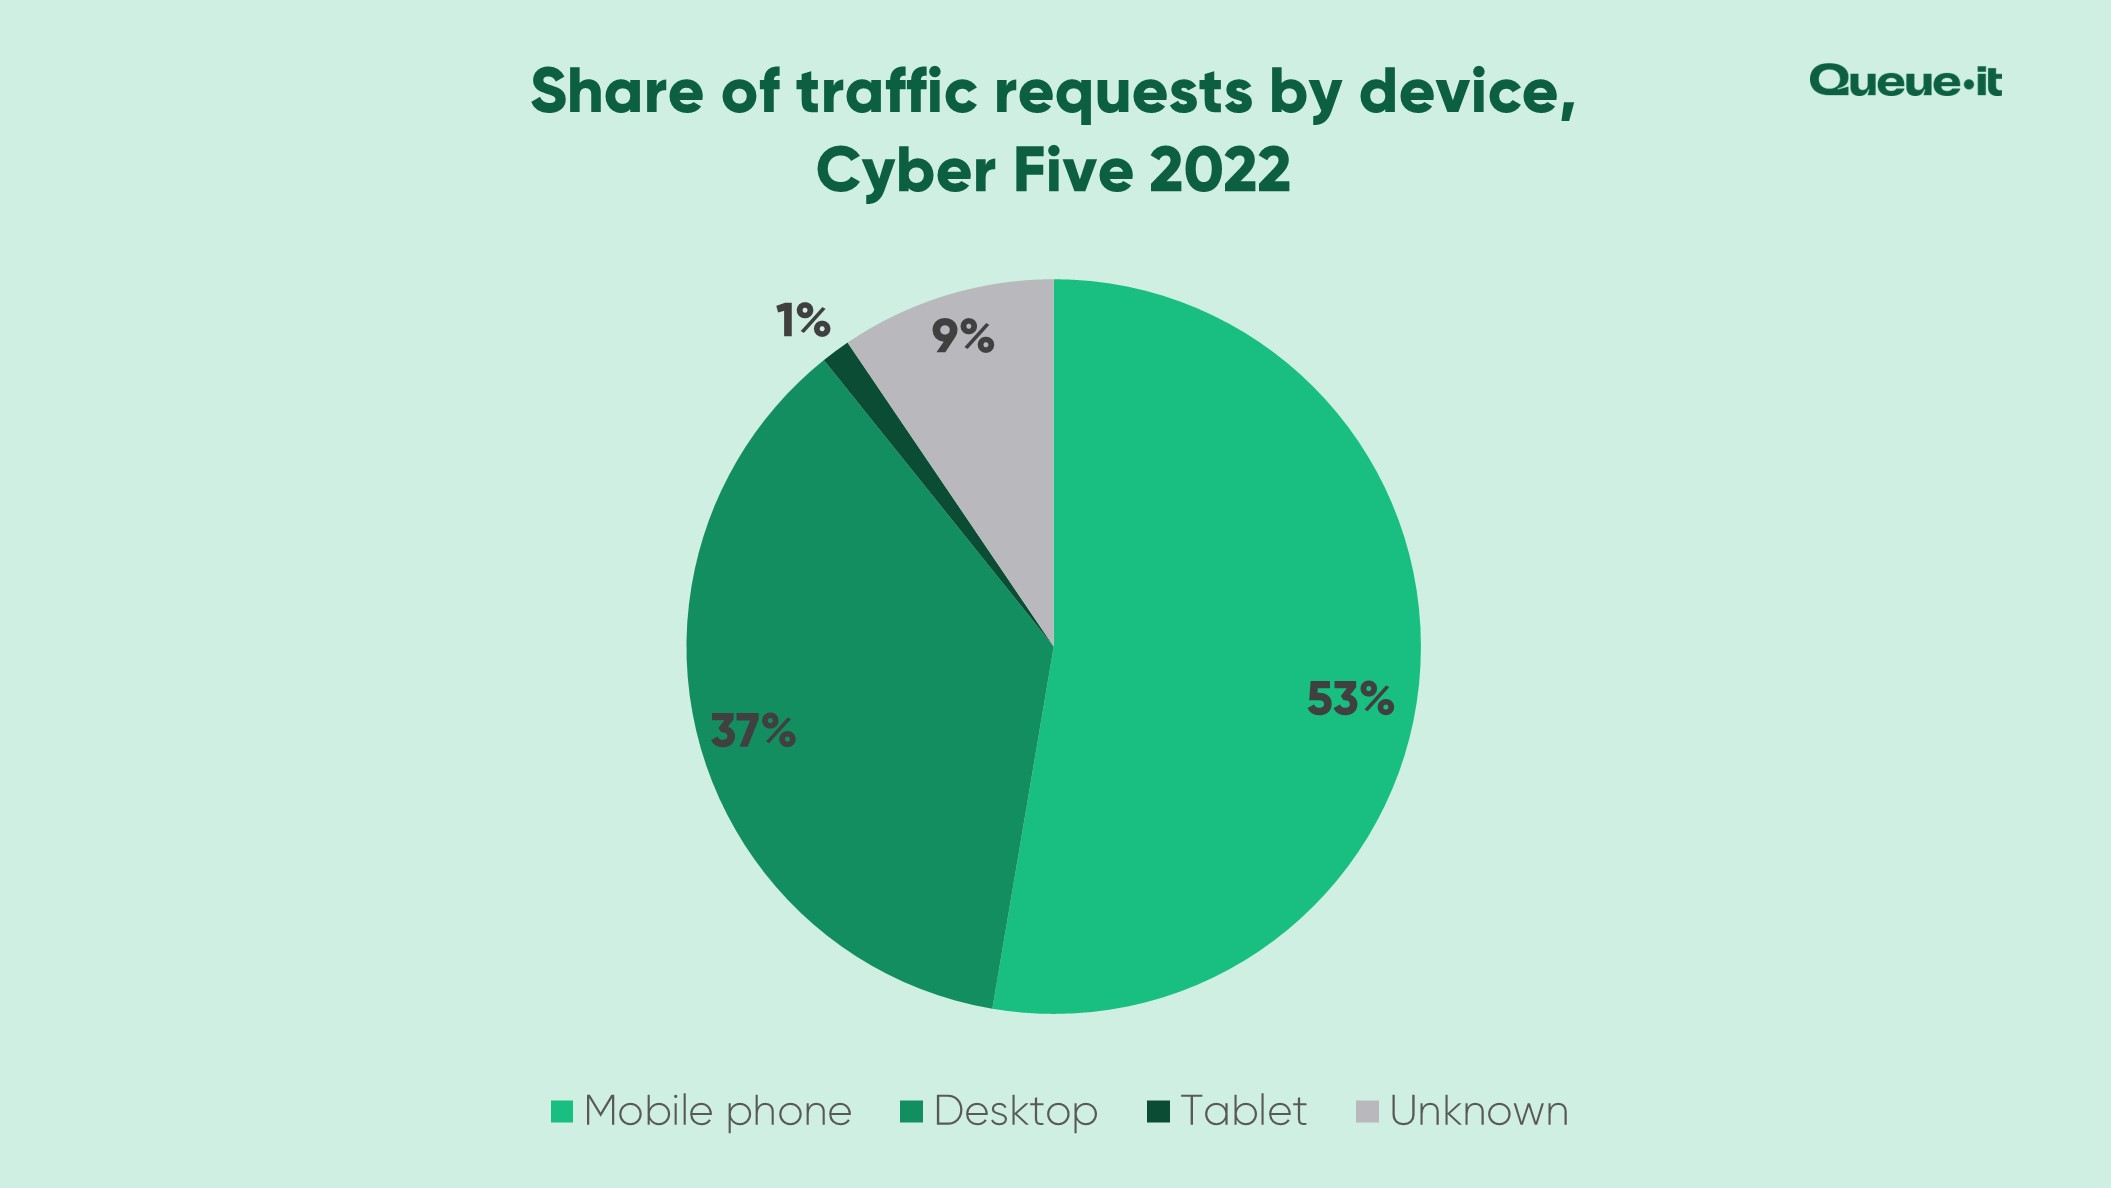
Using Traffic Insights on a sub-sample of 55 out of the 65 retail customers, we saw 53% of all Holiday Season web visits were made on mobile.
Desktop was the second most popular source of traffic requests, at 37%.
The rise in mobile shopping (or mcommerce) goes hand-in-hand with the growth of ecommerce.
As is the case throughout the year, conversion rates remained higher on desktop than on mobile. Holiday Season conversion rates came in at 5.6% on desktop, compared to 3.3% for mobile.
This lower conversion rate is typically attributed to the slower loading speed on mobile sites, which take on average 88% longer to load than desktop sites.
Knocking just 1 second off your site’s mobile load speed will boost conversion rates by 9% and decrease bounce rate by 9%.
With 53% of Holiday Season traffic coming from mobile and thousands of competitors just a click away, it’s crucial your mobile site is optimized for 2023.
RELATED: 91 Powerful Statistics That Show Why Your Ecommerce Site Speed Matters in 2023
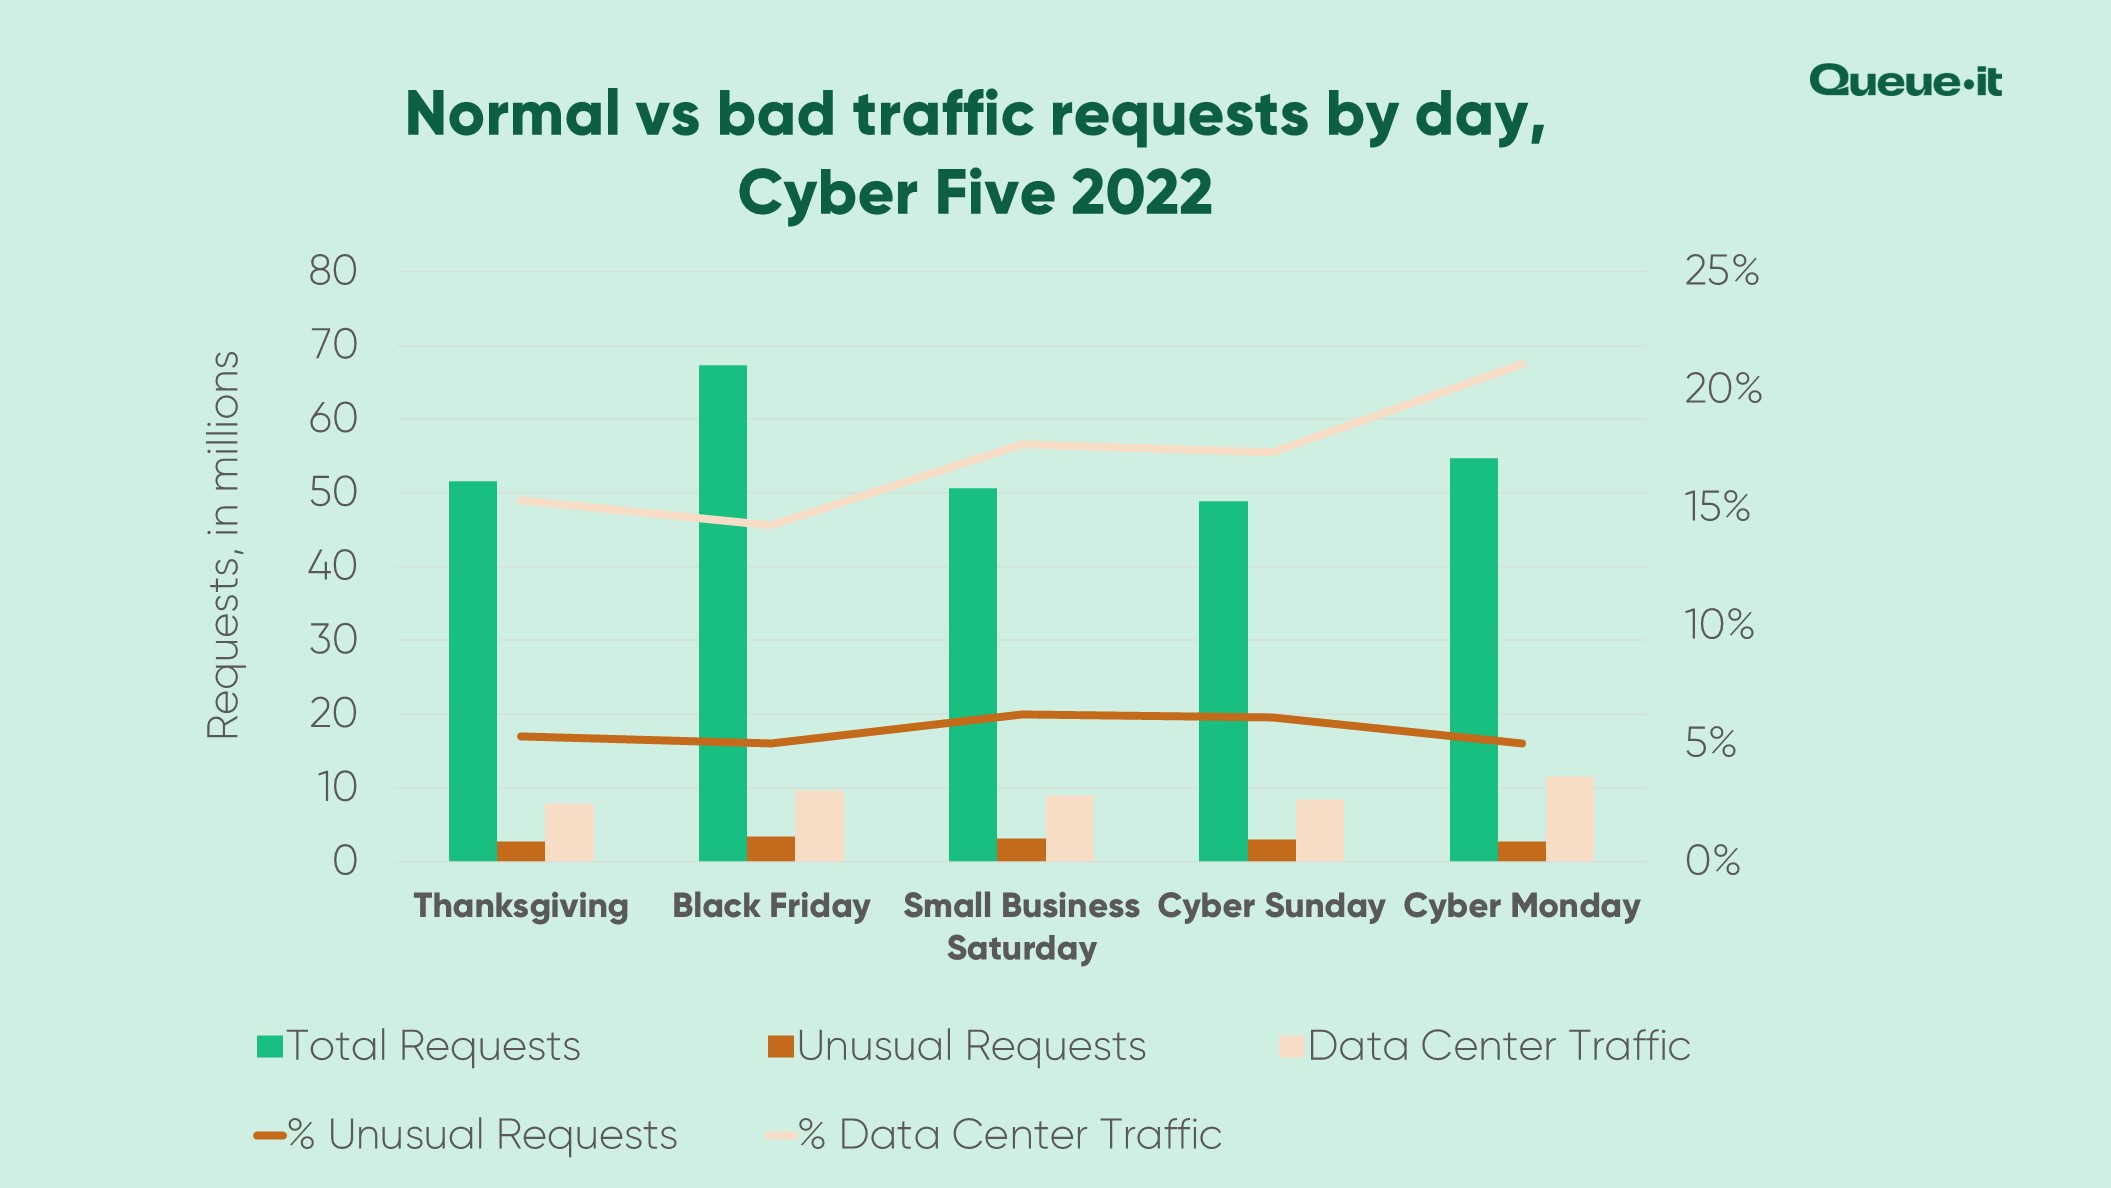
Up to 23% percent of all Holiday Season traffic in 2022 was what we call “bad traffic”, which includes data center traffic and unusual requests.
Data center traffic comes from massive buildings with racks of servers and computing infrastructure. Traffic from a data center is rarely coming from a genuine visitor. Most likely it's a bad bot or malicious web scraper running on a rented server, or a visitor trying to mask his or her identity by connecting with a VPN whose server is in the data center.
Unusual traffic requests come from visitors whose behavior or technology setup suggests to Queue-it that they're not genuine.
Over the Cyber 5 in 2022, 17% of traffic requests came from data centers, and 6% unusual requests. (A request can be flagged as both unusual and from a data center, so the range is as low as 17% and as high as 23%).
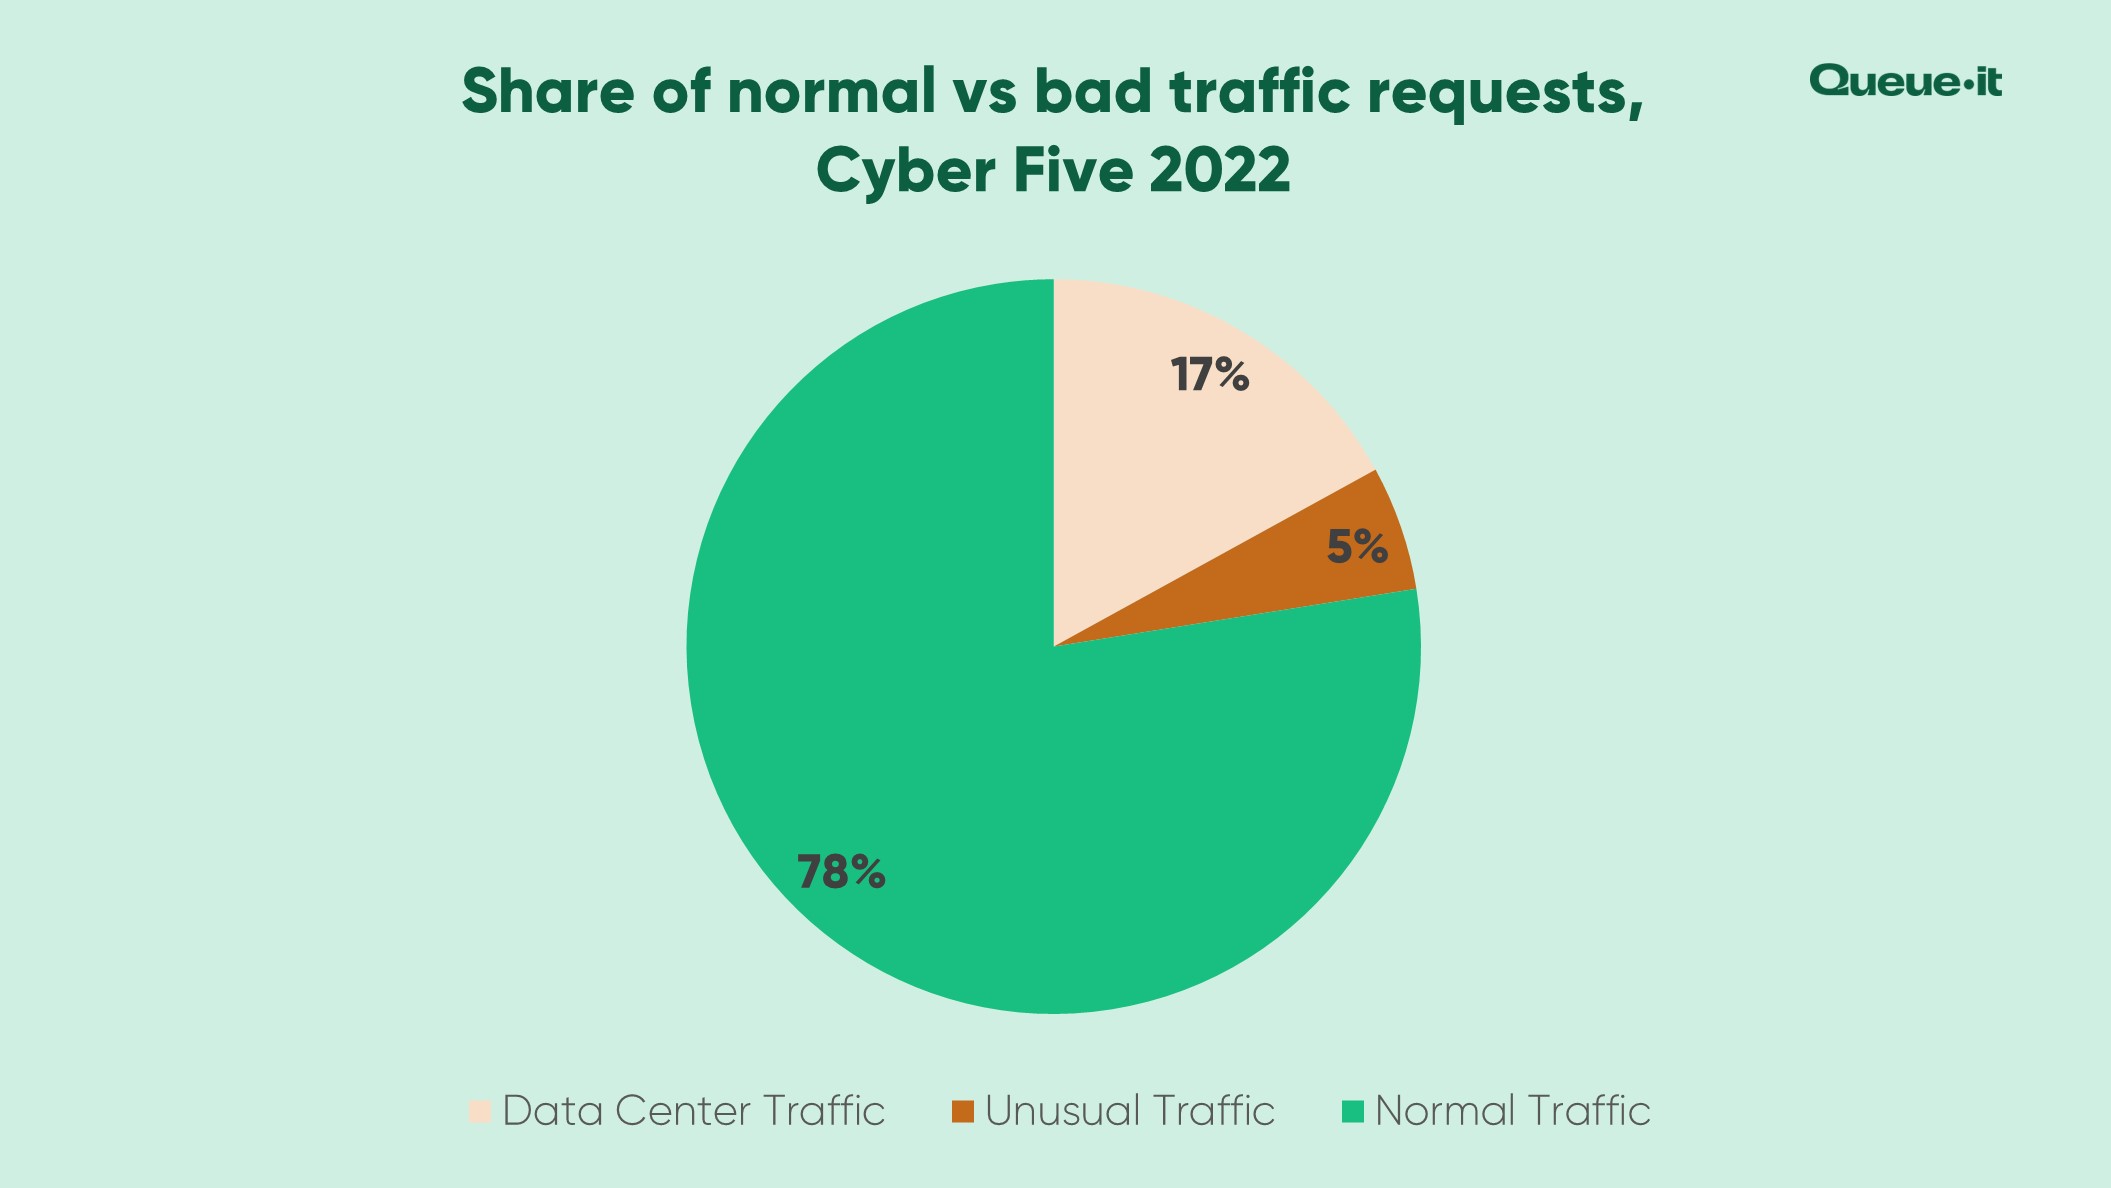
The share of unusual requests remained relatively stable across the Cyber 5 at between 5-6%. Black Friday saw the lowest share of data center traffic during the period, at 14%. Cyber Monday saw the highest, with over 21% of all traffic requests emanating from a data center.
This kind of traffic drives up retailers’ cloud computing costs, screws with conversion rates and other important analytics, and can even crash your site if it comes in too much volume.
RELATED: Everything You Need to Know to Prevent Online Shopping Bots
The launch of Traffic Insights this year allows Queue-it customers to identify and block this bad traffic. As this is a new feature, we can’t make a YoY comparison, but will report on the change in bad traffic in our 2023 Holiday Season Online Traffic Report.
Holiday Season traffic was mostly flat in 2022, but this comes after two years of unprecedented ecommerce growth, a year of huge inflation, and constant news of an upcoming recession.
In this context, that traffic didn’t drop more dramatically is a continued sign that ecommerce is only set to grow in prominence.
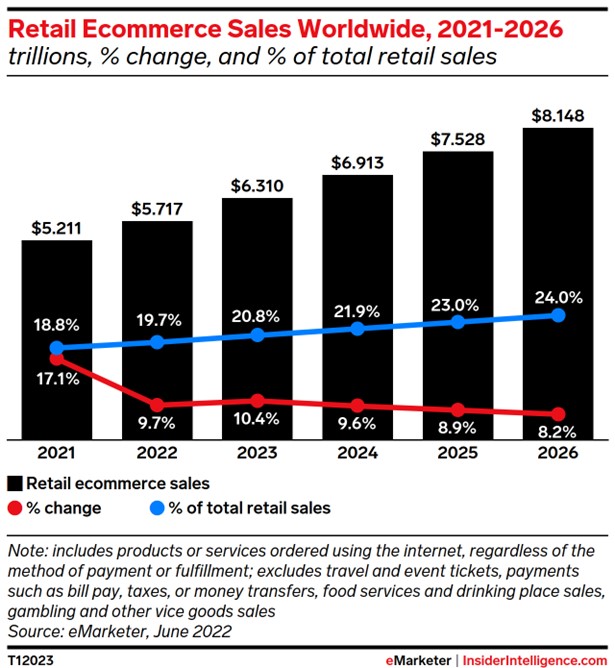
The share of total global retail sales made online is still expected to rise this year, from 18.8% in 2021 to 19.7% in 2022.
That means almost $20 out of every $100 spent by consumers in 2022 was spent online.
Shoppers are shopping earlier, and marketers are marketing earlier. It’s no longer enough to just advertise and offer Black Friday deals.
Your Holiday Season sales and marketing need to start earlier, both to match changing consumer behavior and to attract loyalty ahead of the two biggest shopping months of the year.
In 2022, many retailers leveraged frequent, smaller shopping events like exclusive sales open only to loyalty program members and product drops that leverage scarcity marketing.
RELATED: How to Use Scarcity Marketing & Product Drops for Black Friday Success
The Holiday Season may be getting longer, but Cyber Five (and Black Friday in particular) still see traffic up to 3x what retail sites usually face.
Retailers that are unprepared for these spikes will face site slowdowns, errors, and even crashed websites. This year major retailers from Walmart to Bath & Body Works to Nike used virtual waiting rooms to protect their sites from Holiday Season spikes.
RELATED: How High Online Traffic Can Crash Your Website
As Walmart’s SVP of Site Experience told RetailMeNot, “virtual queuing helps ensure that the greatest number of our customers can purchase hot items during these events. We know it can be frustrating when customers try to purchase higher demand items and either can’t add to cart or can’t check out before the item is out of stock.”
RELATED: The Comprehensive Guide to Virtual Waiting Rooms: All Your Questions Answered
With up to 23% of all traffic across over 1.7 billion Holiday Season visits identified as bad traffic, it’s not something retailers can afford to ignore.
Bad traffic drives up your cloud computing costs in a time where retailers are retailers are struggling with their margins. It spoils your analytics, making your data on things like conversion rate, cart abandonment, and overall traffic unreliable. It can overwhelm your site, leading to crashes, slowdowns, and errors. And when it’s online shopping bots, it snatches inventory out of the hands of your real customers, breaking down loyalty and trust.
As Queue-it co-founder Niels Henrik Sodemann told Digital Commerce 360, “bot traffic has been increasing exponentially, and it now makes up 29.5% of all traffic to retail sites. This adds to the load retailers have to cope with on major sales days.”
The impacts of bad traffic are mostly invisible to retailers that rely on tools like Google Analytics alone to understand traffic.
Traffic Insights gives retailers a more accurate understanding of what Holiday Season traffic really looks like. Combined with a virtual waiting room, you can not only identify bad traffic but also keep it from reaching (and crashing) your site.
RELATED: Traffic Insights: Understand & Act on Your Waiting Room Traffic
All data is based on web traffic from a sample of 65 of our online retail customers. The retailers are based in 25 countries across 6 continents. All traffic date stamps are based on UTC. Year-over-year changes are normalized for the smaller sample of retailers in 2022.