
The Black Friday 2020 push began a week early. Electronics and Health & Beauty drove demand. Discover what 1.57 billion online visits reveals about the global 2020 holiday season.
Online retailers knew the 2020 holiday season would be unlike any other.
But beyond that, many questions remained:
- Would shoppers begin shopping earlier?
- Would early sales depress overall ecommerce visits?
- Would landmark shopping events like Black Friday still lead the way?
At Queue-it, we tracked over 1.57 billion visitors across 95 retailers worldwide from Nov 1 to Dec 21, 2020 to help understand what the data can teach us about the 2020 holiday season.
We provide retailers with a virtual waiting room to help them control traffic surges to their websites and apps. Although visitors only see a waiting room page when a website or app experiences traffic overload, Queue-it has insight into all traffic requests while the virtual waiting room is in place.
We’ve used this insight to compile our Holiday Season 2020 Report with 7 key takeaways on the state of online retail.
RELATED: 2021 Holiday Shopping Online Retail Traffic Statistics: 2.54 Billion Visitors
1. Holiday season 2020 traffic grew 207% over 2019
In 2019, our virtual waiting room tracked 294.6 million visits from the Wednesday before Black Friday through the end of the year (November 27th - December 30th, 2019). In 2020, our virtual waiting room tracked 896.2 million visits from the Wednesday before Black Friday (Nov 25th, 2020) through December 21st.
When normalizing for a larger retailer sample and slightly shorter 2020 timeframe, online retail traffic grew 207% over 2019.
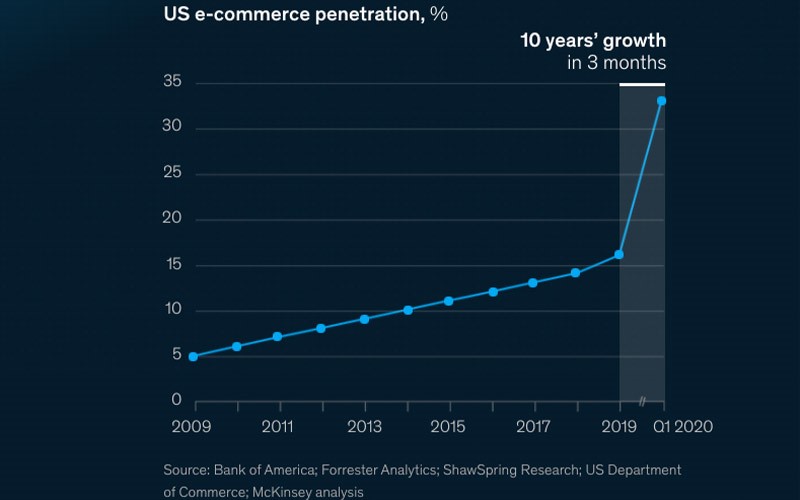
This data affirms a supercharged push to online retail in 2020. Ecommerce sales growth has hovered consistently around 15% year-over-year. But just in Q1 2020 alone, reporting from McKinsey showed 10 years’ worth of growth in U.S. ecommerce penetration. An uptick in online visitors, which our data supports, is the first step to increasing online sales.
2. Electronics drove most demand, followed by Health & Beauty
When we break down traffic by category, Electronics retailers came away the clear winner in attracting digital foot traffic. Visits to electronics retailers reached 477.5 million during the 2020 holiday season, making up 30% of all traffic during the period. Electronics retailers were especially popular during Black Week (the Monday before Black Friday through Cyber Monday), when they received 36% of total online traffic.
Health & Beauty came in second, with 400.7 million visitors, or 25% of all traffic. Mass merchants/Department stores were third most popular, with 294.6 million visitors, constituting 18% of all 2020 holiday season traffic.

Interesting to note is apparel’s distant fourth place finish. According to Retail Dive’s analysis of U.S. Commerce data, the clothing & accessories segment has been particularly hard hit this year, faring 20% worse in year-over-year sales.
While the same U.S. Commerce data shows electronics also underperformed last year, our data shows strong global demand. Releases of hyped gaming consoles and traditional Black Friday bargains at a time when consumers are especially price sensitive are likely behind the demand for electronics that our data shows.
When it comes to Health & Beauty, ecommerce in 2020 has been a boon to retailers and brands, according to a McKinsey report. The report anticipates a quick rebound in 2021. Our data certainly signals interest in Health & Beauty during the 2020 holiday season and bodes well for the segment moving forward.
3. The Black Friday 2020 push started a week early
A clear online retail strategy in 2020 was to start sales earlier. We saw leading companies like Walmart, Target, Home Depot, Best Buy, and Amazon begin deals several weeks in advance of Black Friday.
RELATED: Ecommerce Strategies for Success This 2020 Holiday Season
According to a November 2020 McKinsey survey, consumers were ready to change their shopping habits, too. 33% of shoppers planned shop earlier than last year, while only 7% planned on shopping later.
And this came through in the global data, too.
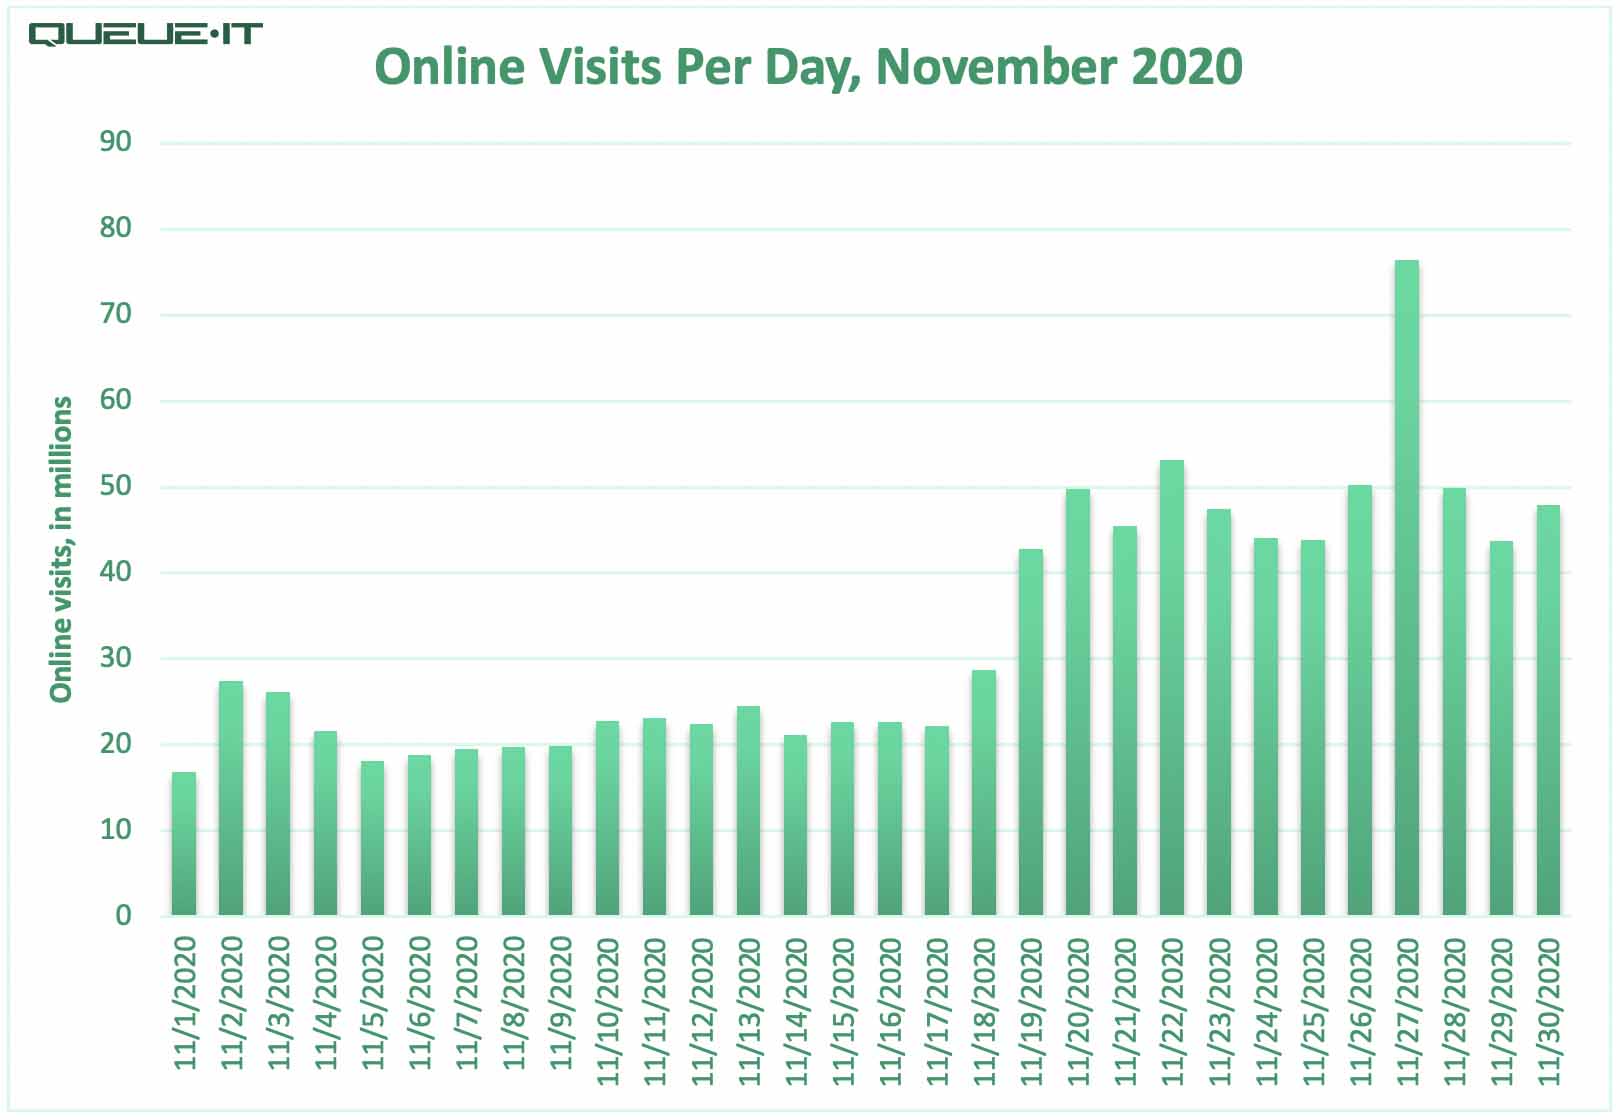
Starting November 19th, daily online visits more than doubled from an average of 22 million visits to 49 million through Black Week.
“Online holiday shopping traffic has been peaking earlier and lasting longer,” says Queue-it Co-founder and Chief Communications Officer Camilla Ley Valentin. “Last year the shortened holiday season calendar put pressure to extend the shopping season. In 2020, the pandemic-related push towards ecommerce accelerated these trends even faster.”
In addition, several retailers in the United States closed their physical store doors on Thanksgiving Day, leaving shoppers with no choice but to shop online.
4. Black Friday has become Black Week
This year we saw retailers moving away from “Black Friday” terminology, instead embracing terms like “Black Weekend” and “Black Week” (we’ve even seen “Black November” get tossed around!) to highlight longer-running sales.
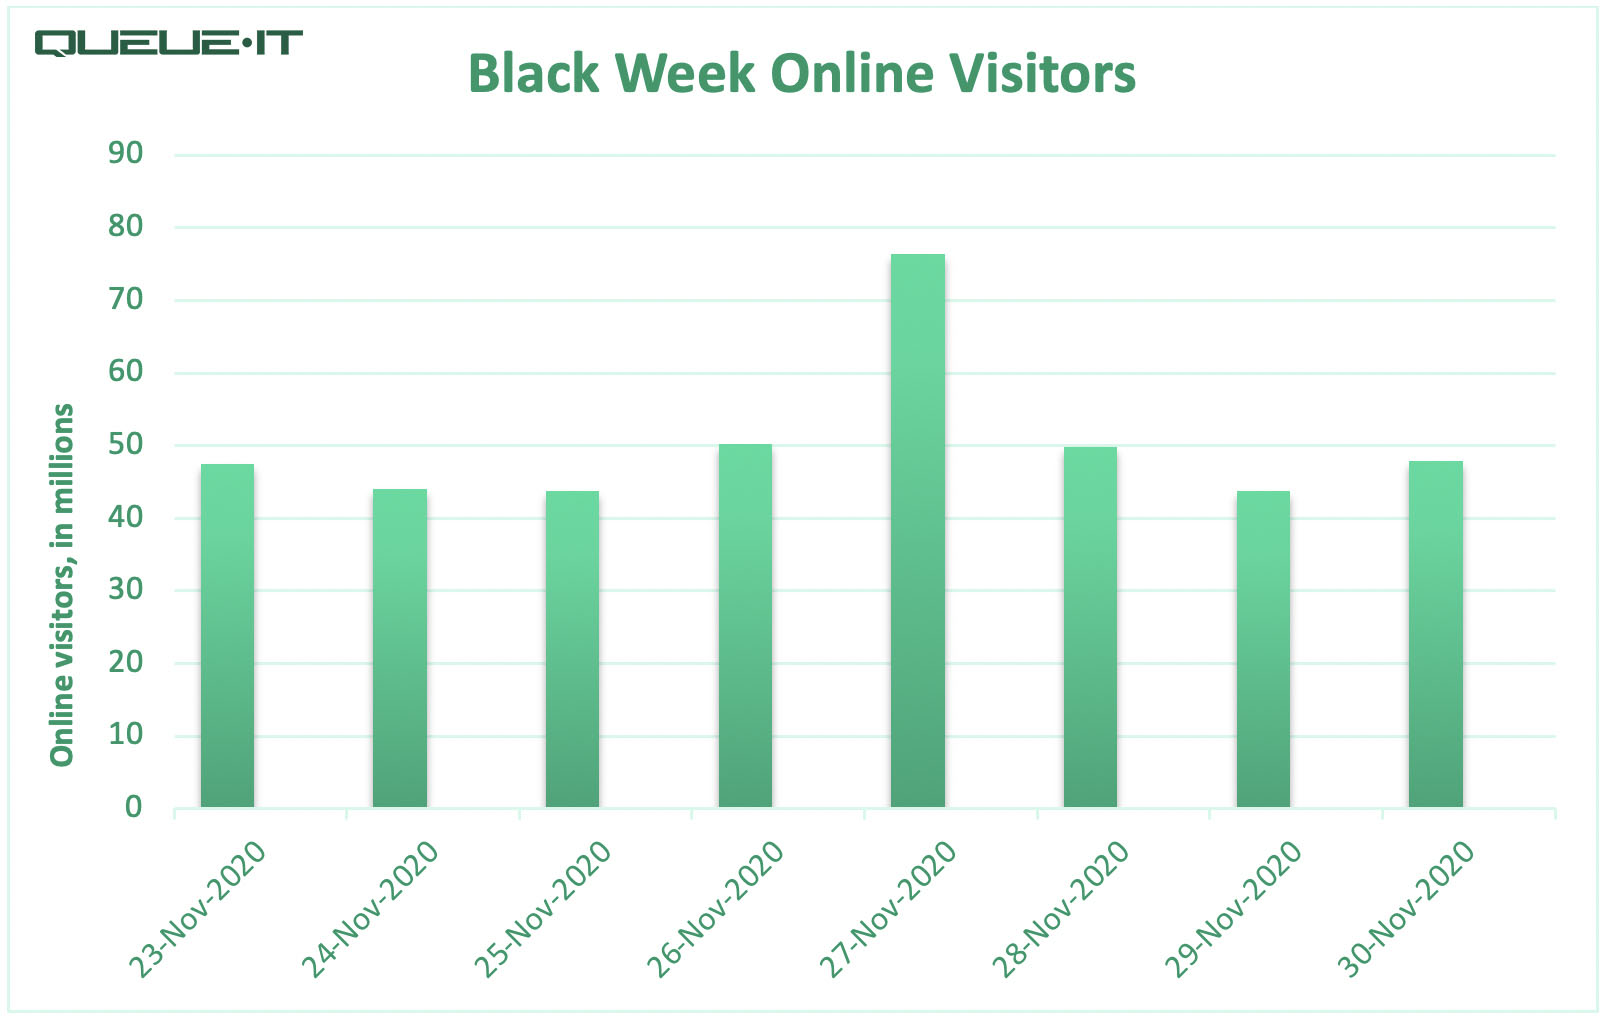
In total, our virtual waiting room tracked 403.4 million visits during Black Week 2020, which represents a 105% increase over 2019, when normalized for a larger retailer sample in 2020.
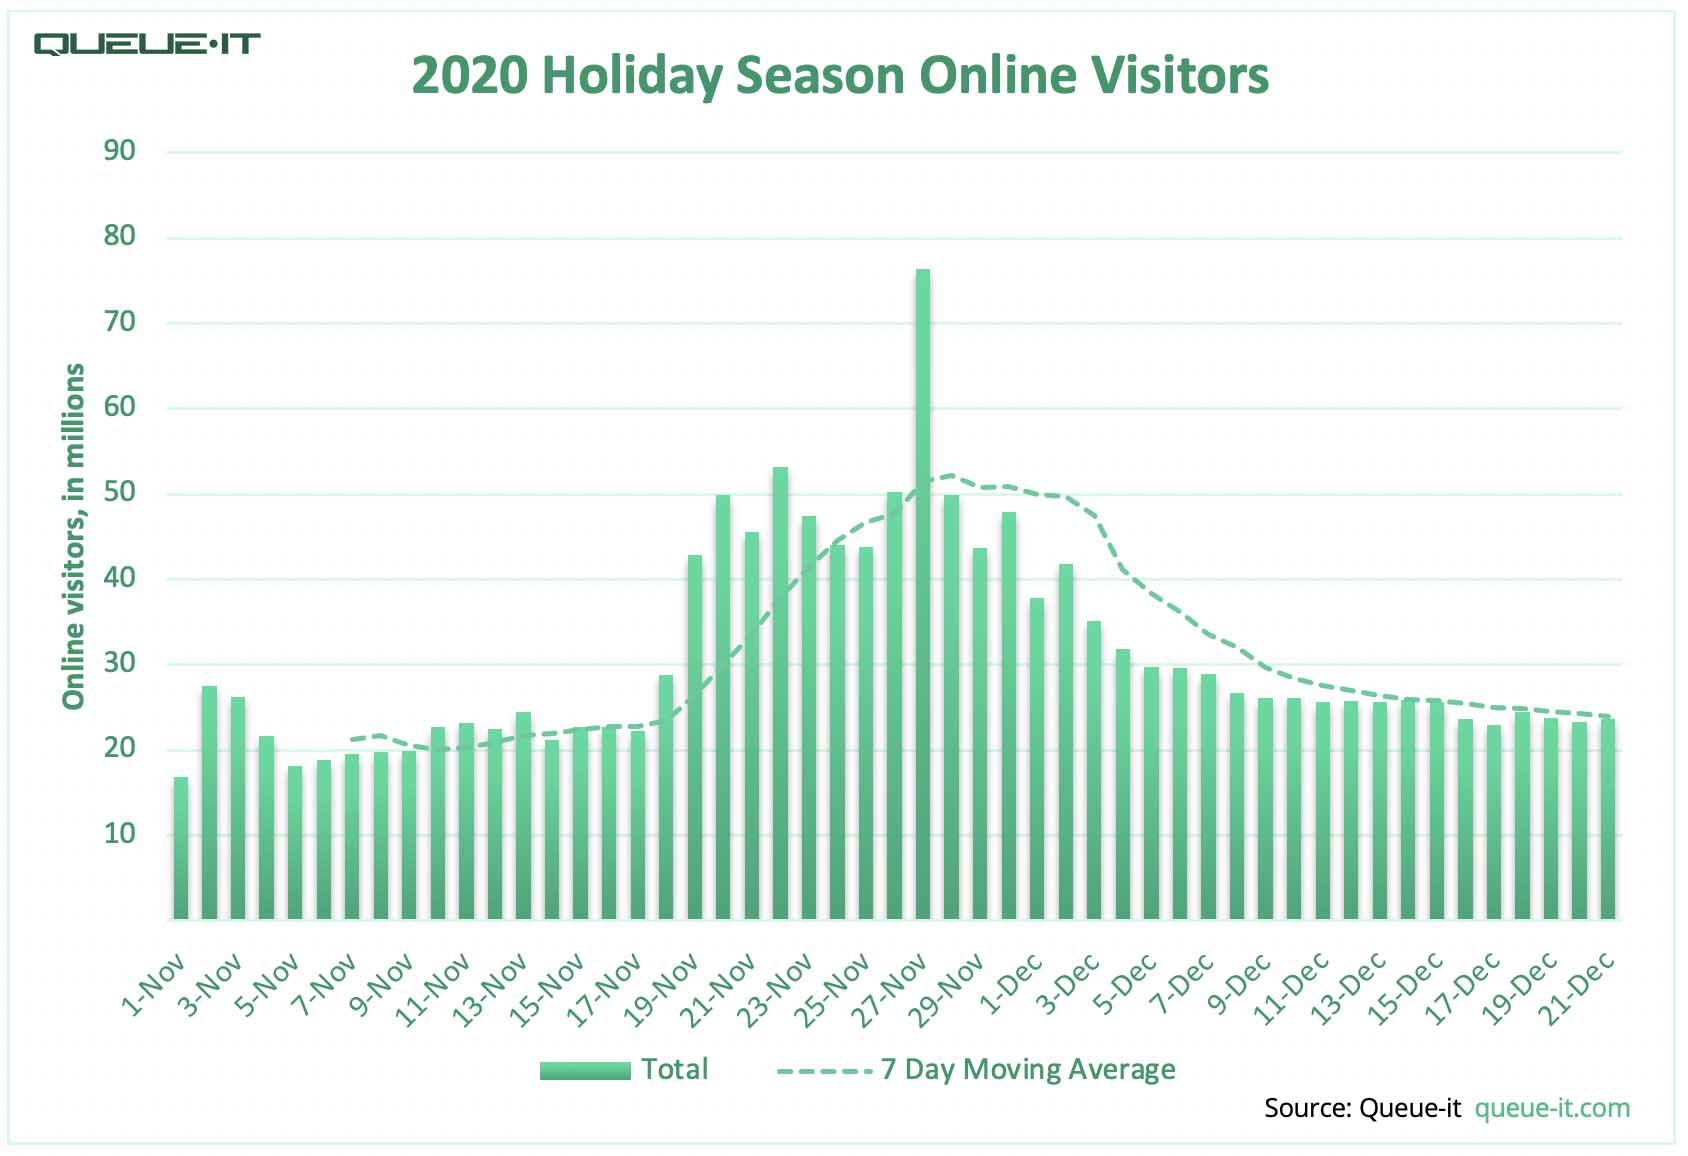
The increase was driven in part by outsized performance in the days leading up to Black Friday. In 2020, traffic remained impressively elevated across the entirety of Black Week, with a spike in demand on Black Friday itself. This contrasts with previous years where we’ve seen weaker traffic leading up to Black Friday, or a post-Black Friday drop-off over the weekend.
5. Black Friday records highest traffic in 2020 holiday season
With 76.4 million visitors, Black Friday itself remained the day with the most compressed surge in online traffic. Traffic on the day of Black Friday represented 19% of the total 403.4 million visits over the 8-day Black Week period.
This tracks with November 2020 survey data from McKinsey, who reported that 56% of global respondents planned to shop on Black Friday, the most popular shopping period chosen.
An average of 10% of visitors on Black Friday saw a Queue-it waiting room before entering the retail site, with the percentage ranging from 0-100% across individual sales.
The virtual waiting room acts as a safety net for retailers, protecting 24/7 against sudden peaks in online visitors. Often, retailer websites have capacity, and shoppers don’t realize the virtual waiting room is in place. But when our customers send visitors to a waiting room, it’s evidence of traffic peaks that might otherwise overwhelm their sites.
6. Early deals didn’t seem to deflate later visits
Entering the 2020 holiday season, it was unclear whether consumers’ uncertain financial health and retailer’s push to start sales earlier would lead to a precipitous drop-off in online traffic after Black Friday.
While our data shows an early push to Black Week, as we detailed earlier, our data does not show a sudden post-Black Friday drop-off.
7. What does this all mean for online retailers?
The original data we’ve shared here has many ramifications for retailers. Here’s how we would sum up what the data signals to online retailers:
- Digital is now every retailer’s new flagship store. 207% growth in ecommerce traffic over 2019 demonstrates the sort of supercharged push towards ecommerce we’ve seen across the board this year. Handling increased online demand to capture growing spend is a formidable challenge for any retailer and a business necessity for every retailer.
- As industry surveys had predicted, shoppers flocked to retail sites early in 2020, driving enormous traffic to retail websites in the seven days leading up to Black Friday. Retailers will have to handle online shopping traffic that peaks earlier and lasts longer.
- Shoppers clamored for Electronics and Health & Beauty products in 2020. The levels of traffic these retailers saw underscore the need to manage hyped product launches and releases, whether gaming consoles or beauty products.
- Black Friday reigned supreme with 2020’s price sensitive consumers, in line with consumer survey results. Compressed surges in traffic threatened to overload retailers who didn’t have mitigation measures in place.
A note on methodology
Our data is based on web traffic from a sample of 95 of our online retail customers. The retailers are based in 25 countries across 6 continents. All traffic date stamps are based on UTC. Year-over-year changes are normalized for a larger sample of retailers in 2020. The 207% overall increase is also normalized for a shorter data timeframe in 2020 (November 27th - December 30th, 2019 vs November 25th - December 21st, 2020).