
Mobile traffic grows 9%. Cyber Five replaced as biggest week. Early access drives traffic increases of up to 63%. Data center and bot traffic surges almost 30%. Discover the key statistics and trends 2.4 billion online visitors reveal about the global 2023 Holiday Season. And get 4 key takeaways for online retailers to prepare for 2024 holiday shopping.
After three straight years of growth, ecommerce web traffic during the Holiday Season fell by 7% year-over-year (YoY) for the first time in 2022.
As the 2023 Holiday Season approached, investors and retailers speculated widely. Could ecommerce could reignite the growth of the pre-pandemic years? Or would inflation and economic uncertainty make its mark?
At Queue-it we tracked 2.4 billion visitors across 198 retailers worldwide from Nov. 1 to Dec. 21, 2023, to get the answers to these question and more. Discover the key holiday shopping traffic insights and stats you need to understand consumer behavior and prepare for the 2024 Holiday Season.
Queue-it provides a virtual waiting room solution that helps retailers prevent website crashes and control traffic surges to their websites and apps. Although visitors only see a waiting room page when a website or app experiences traffic overload, Queue-it has insight into all traffic requests while the virtual waiting room is in place.
Here are the 20+ key Holiday Season shopping statistics and insights you need to know from 2.4 billion retail web visitors.
Note: All year-over-year (YoY) comparisons are made with a control group of retailers Queue-it worked with in both 2022 and 2023. In-year comparisons are made with the full list of 198 retailers.
Table of contents & top ten Holiday Season stats
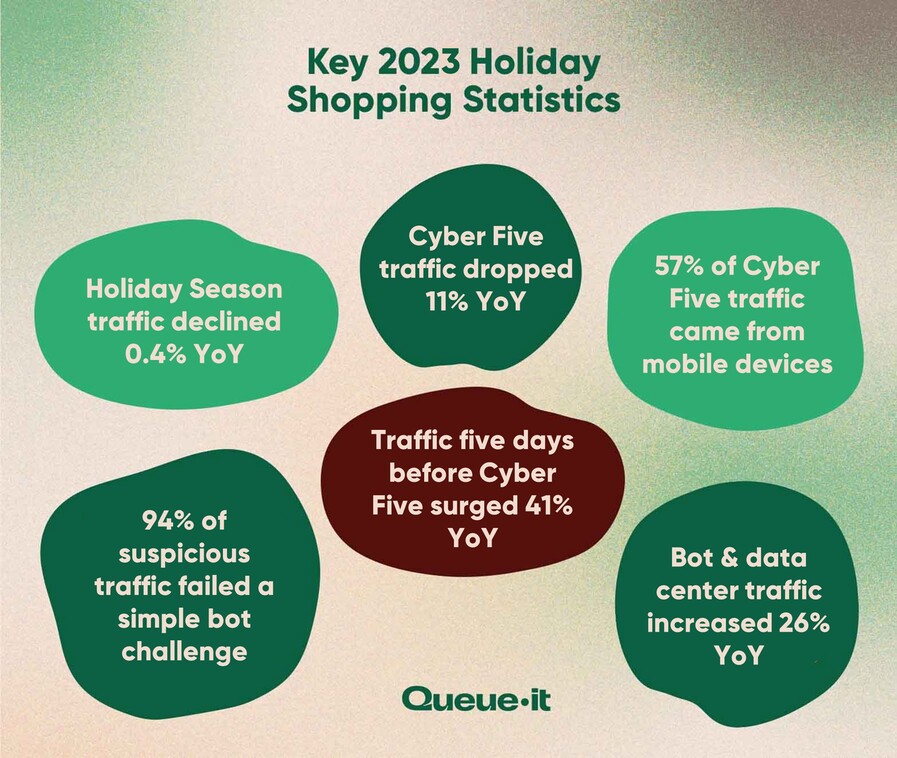
- Holiday Season traffic declined 0.4%
- Traffic first week of November increased 9%
- Traffic five days before Cyber Five surged 41%
- Cyber Five Traffic declined 11%
- Thanksgiving & Cyber Monday replaced as top days
- Black Friday sees traffic almost 2x that of average October day
- Electronics retailers account for 53% of total traffic
- Mobile traffic during Cyber Five increased 8%
- Bot and data center traffic across Cyber Five increased 26%
- 94% of supsicious traffic failed to solve a simple challenge
- 4 key takeaways for online retailers
While online Holiday Spending increased 6.3% YoY in 2023, our data showed retail web traffic was relatively flat.
Across the same subset of retailers, traffic from Nov. 1-Dec. 21 declined 0.4% YoY—from 1.654 billion to 1.648 billion. That’s a decline of just 650k web visits across the 51 days, our smallest YoY change on record.
This finding largely tracks with the overall sales volume data from sources like Adobe and MasterCard, which don’t take inflation into account when reporting their sales figures.
But while traffic was relatively flat, the patterns of traffic this year were very different. Let’s look at how.
The Holiday Season has been getting longer for several years now—with some now dubbing the entire month of November “Black Month”.
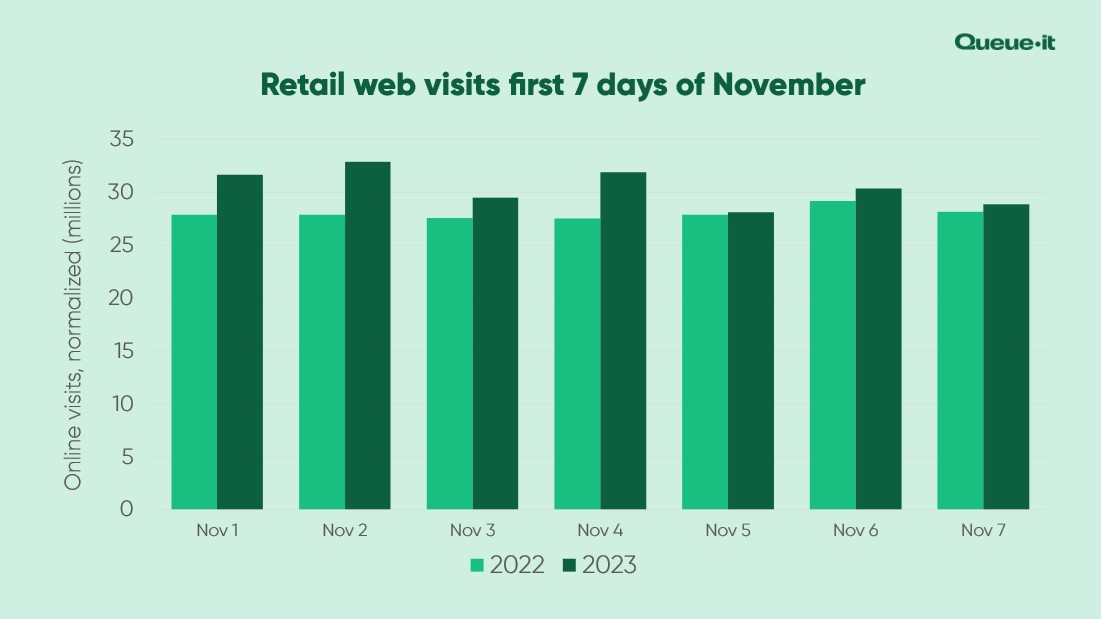
In 2022, traffic in the first week of November surged a massive 47% YoY.
In 2023, this trend continued, with traffic from Nov. 1-7 increasing another 9%.
What’s behind the shift?
On the retail side, major players are extending the Holiday Season in a race to be the first place consumers spend their Holiday Season budgets. Capturing data and delivering good experiences early in the season also increases the likelihood of consumers making repeat purchases with retailers across the season.
On the consumer side, the supply chain shortages and spikes in “out of stock” messages in recent years have encouraged over-preparedness—with surveys showing around 50% of consumers now start their holiday shopping in October or earlier.
It’s also worth noting that this increase is in web traffic, not spending. So the increase in traffic earlier in the season may result from shoppers browsing stores and exploring deals without yet making purchases.
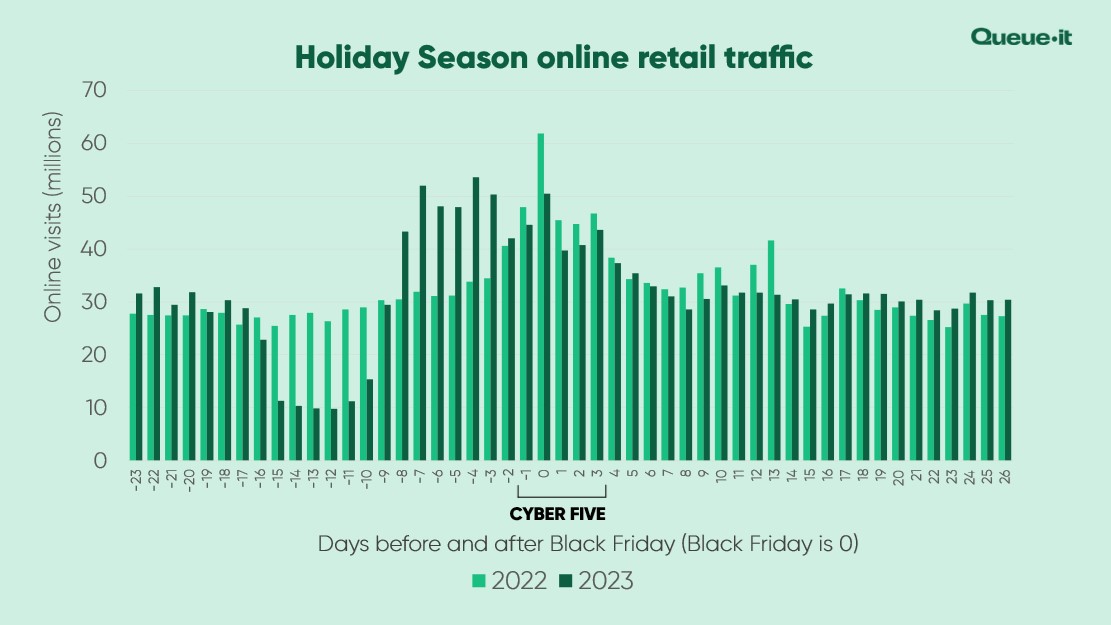
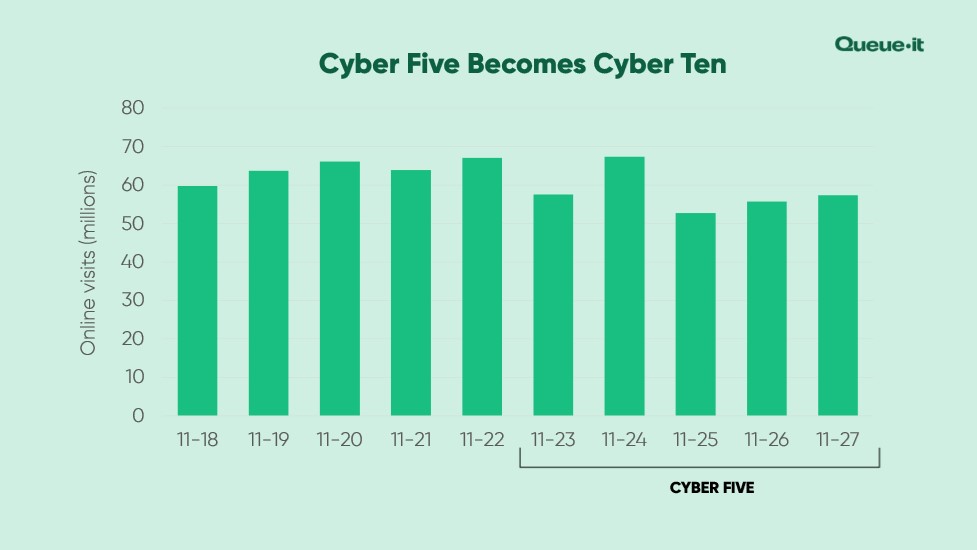
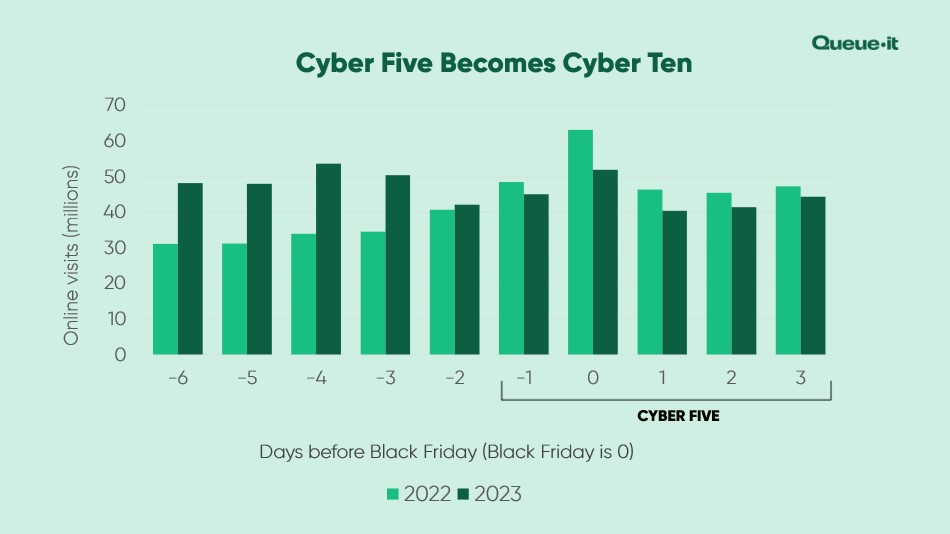
For the first time since Queue-it started tracking Holiday Season data, Cyber Five wasn’t retail’s biggest five days.
That honor went to the five days leading up to Cyber Five.
Traffic from Thanksgiving to Cyber Monday (Cyber Five) totaled 291 million sessions. Traffic from November 18th to 22nd (the day before Thanksgiving) totaled 321 million—10% higher than Cyber Five.
The five days prior to Cyber Five saw traffic surge 41% YoY. Meanwhile, Cyber Five traffic actually dropped by 11%.
The biggest lift in traffic year-over-year came on the Friday before Black Friday, which shot up 63% YoY—from 32 to 52 million sessions. The Monday before Black Friday also increased an impressive 58%—from 34 to 54 million sessions.
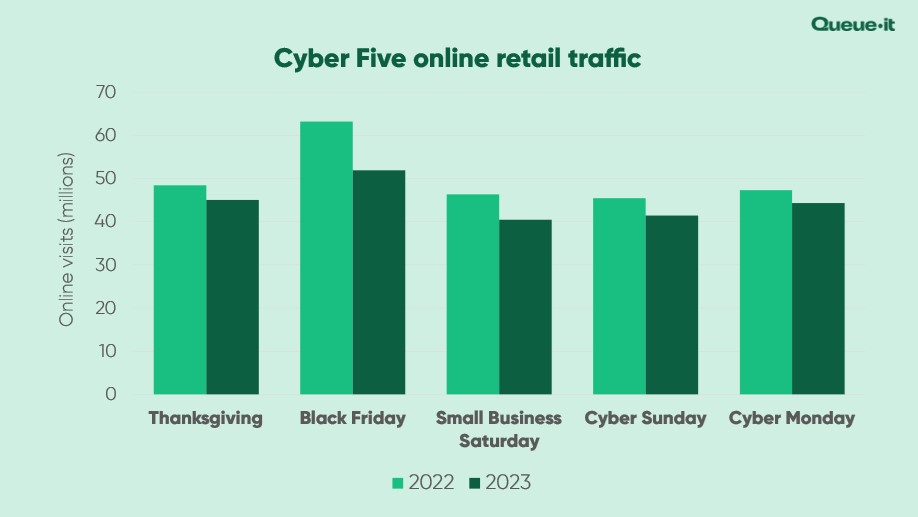
For the second year in a row, we saw Cyber Five online traffic decline at a faster rate than the rest of the Holiday Season.
In 2022, Cyber Five traffic declined 13% YoY. In 2023, it declined another 11%.
Each day from Thanksgiving to Cyber Monday saw smaller traffic volumes in 2023, compared to 2022.
Here’s the year-over-year breakdown of the five days:
- Thanksgiving: -7%
- Black Friday: -18%
- Small Business Saturday: -13%
- Cyber Sunday: -9%
- Cyber Monday -6%
The Cyber Five decline reflects the broader trend of the Holiday Season getting longer, showing how earlier deals and shopping impact what’s traditionally been retail’s biggest week.
Across Cyber Five, Black Friday saw the biggest losses in traffic—declining by almost 20% YoY—while Cyber Monday saw the smallest decline, losing 6% of its traffic.
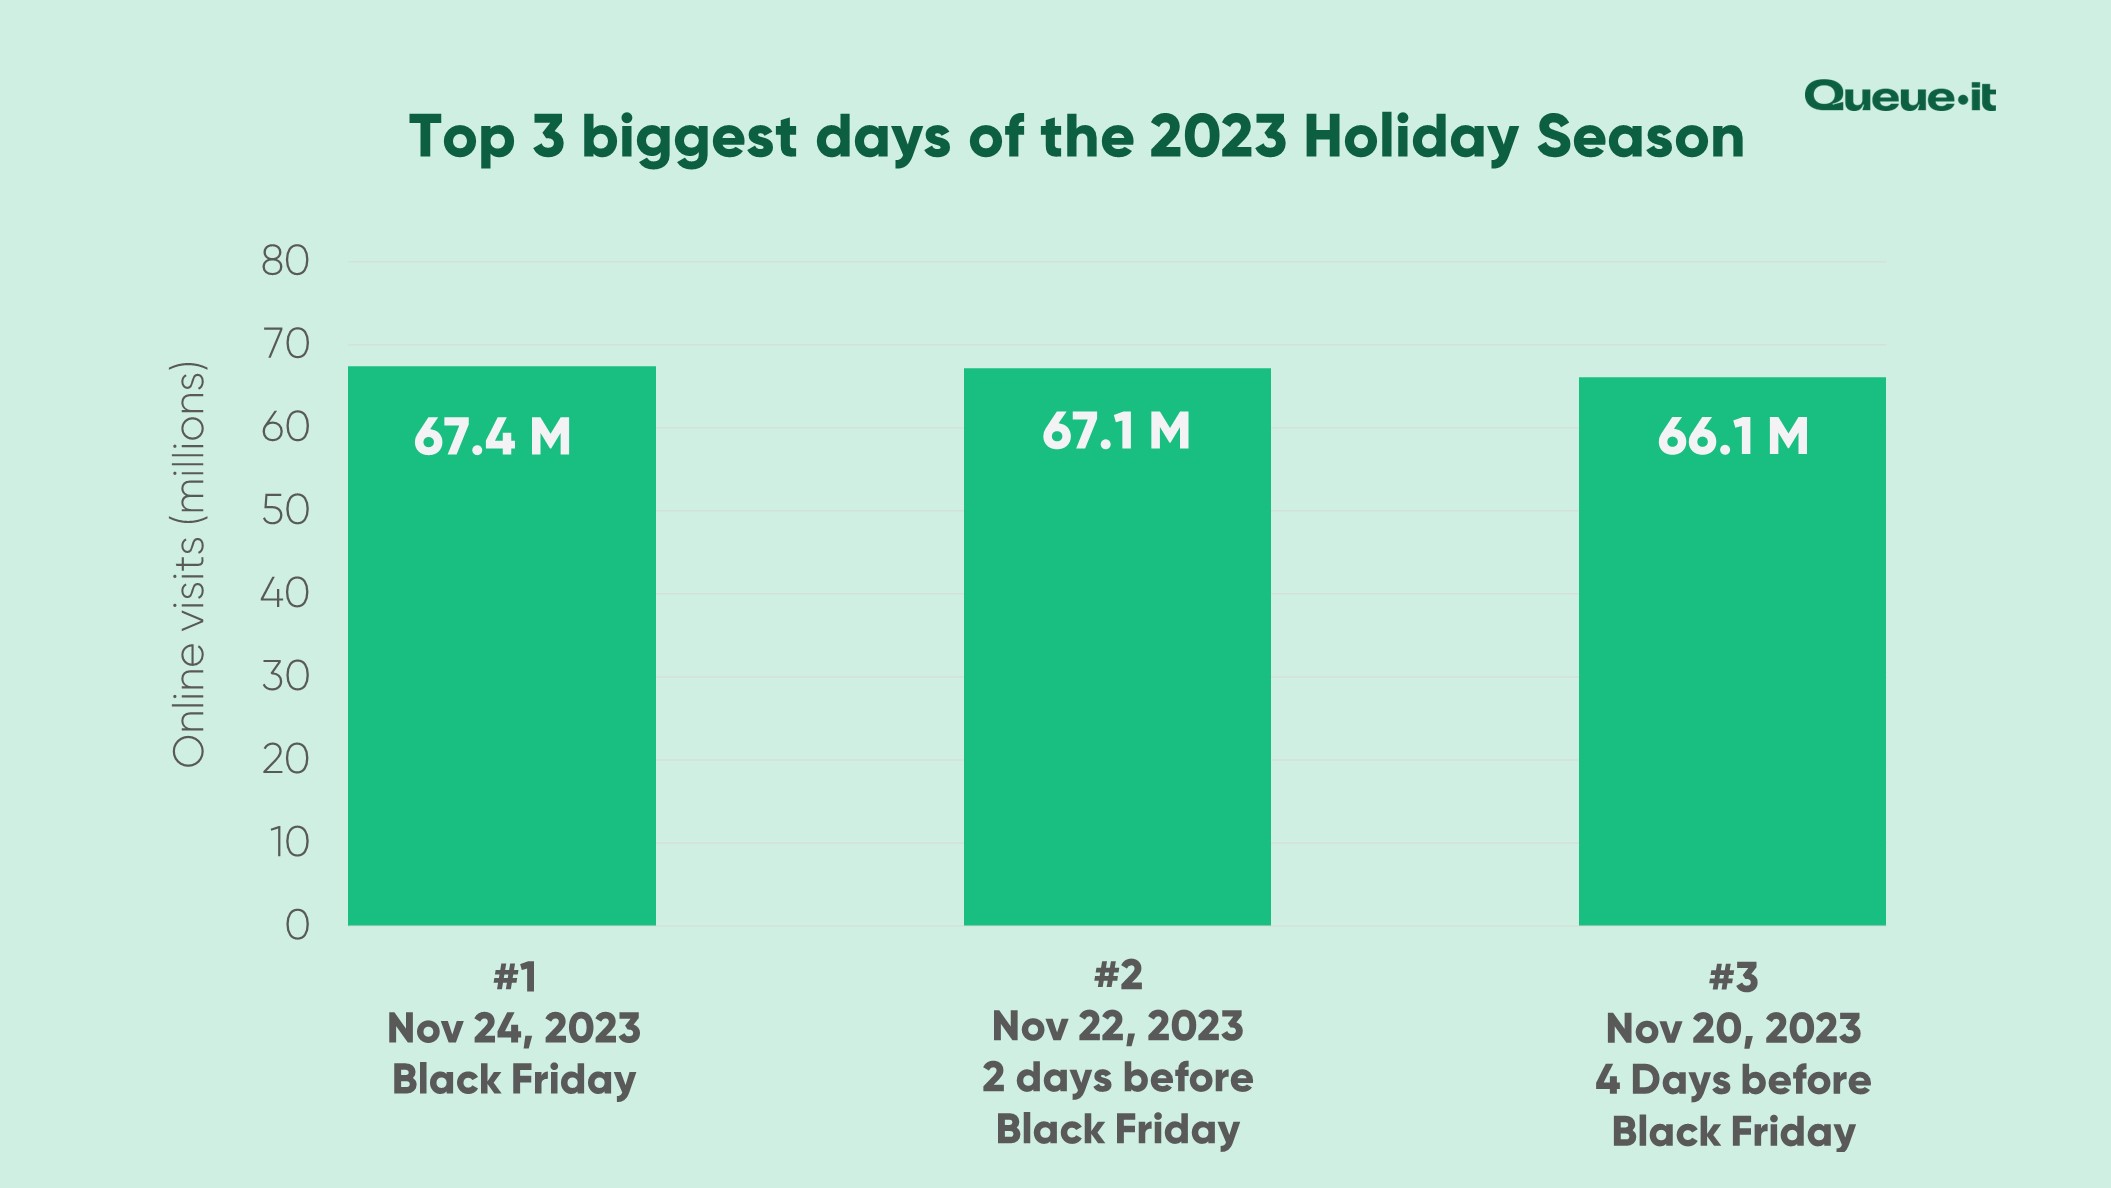
For the fourth year in a row, Black Friday was retail’s biggest day in terms of online traffic.
But for the first time since Queue-it started tracking Holiday Season data, the second and third biggest days of the Holiday Season weren’t part of Cyber Five. Instead, they came during the week leading up to Cyber Five.
After Black Friday, the biggest day of the Holiday Season was November 22, two days before Black Friday. The next biggest day? November 20, four days before Black Friday.
Top 3 highest traffic days:
- Black Friday, November 24th: 67.4 million visitors
- Wednesday, November 22nd: 67.1 million visitors
- Monday, November 20th: 66.1 million visitors
What’s behind this shift?
Early access.
The early access trend in retail is booming. A massive 91% of America’s best apparel loyalty programs now offer early or exclusive access to sales or new products.
Early access to Holiday Season deals creates a powerful incentive for consumers to join loyalty programs, newsletters, and memberships—which are crucial for turning holiday shoppers into returning customers.
Walmart, Amazon, Nordstrom, Target, Best Buy, SharkNinja—dozens of major retailers opened their Black Friday deals to members days before the general public.
Several customers in this sample used Queue-it’s invite-only waiting room to offer secure, exclusive early access to their members in the days leading up to Black Friday. And the results of this powerful sales strategy is reflected in the overall traffic data.
RELATED: Control Sales Access with Invite-only to Engage and Grow Your Customer Base
Despite Black Friday’s YoY decline, it remains a massive day for online retailers.
In raw numbers, we tracked 67 million web visits on Black Friday. That’s almost double that of the average October day (34 million web visits).
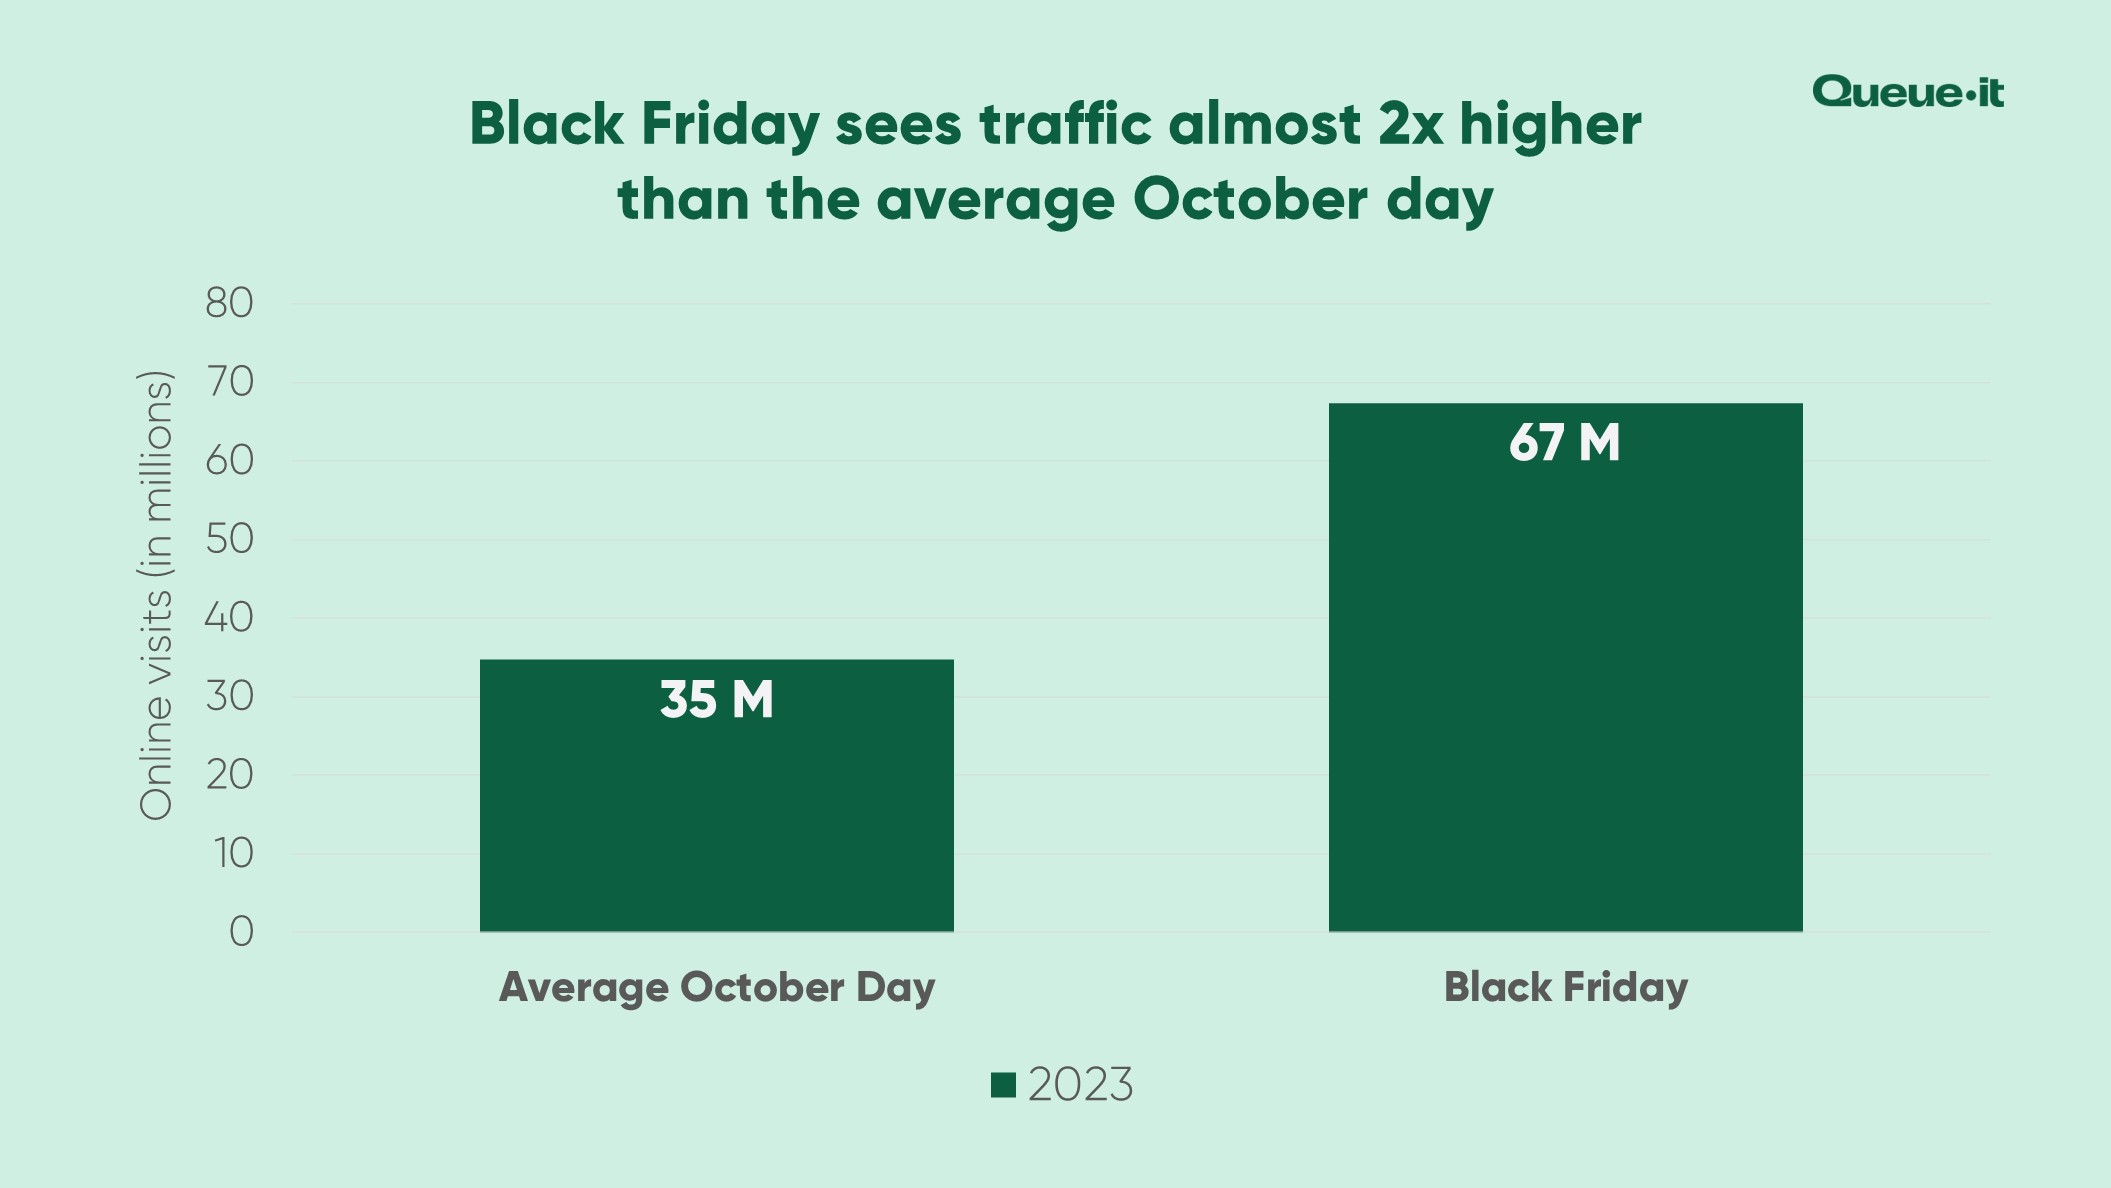
The Holiday Season may be spreading out, but major traffic surges on key days aren’t going anywhere. This Black Friday surge took down Australian tech retailer Harvey Norman—which reportedly lost up to 60% of its revenue on its biggest day of the year.
And with a longer Holiday Season, it’s no longer just traditionally big days like Black Friday or Cyber Monday that pose risks for retailers. Walmart, for instance, made it through its major 2023 Black Friday and Cyber Monday sales with no major website issues. But the retailer wasn’t prepared for the early access rush.
The debut of their early access Holiday Season deals on November 8th crashed both their site and their app. Walmart+ members expecting to reap the benefits of their $13-a-month membership were instead greeted with error pages and bugs.
Website preparedness across the Holiday Season is more important now than ever. Get your free Black Friday guide below to discover how you can run big Holiday Season sales without worrying about your website.
Discover how you can break Black Friday sales records without breaking your site

For the fourth year in a row, electronics retailers saw the largest share of Holiday Season web traffic, accounting for 53% of total traffic.
This is down from 72% in 2022.
Apparel and accessories replaced health and beauty as the second largest category, accounting for 16% of total traffic in 2023.
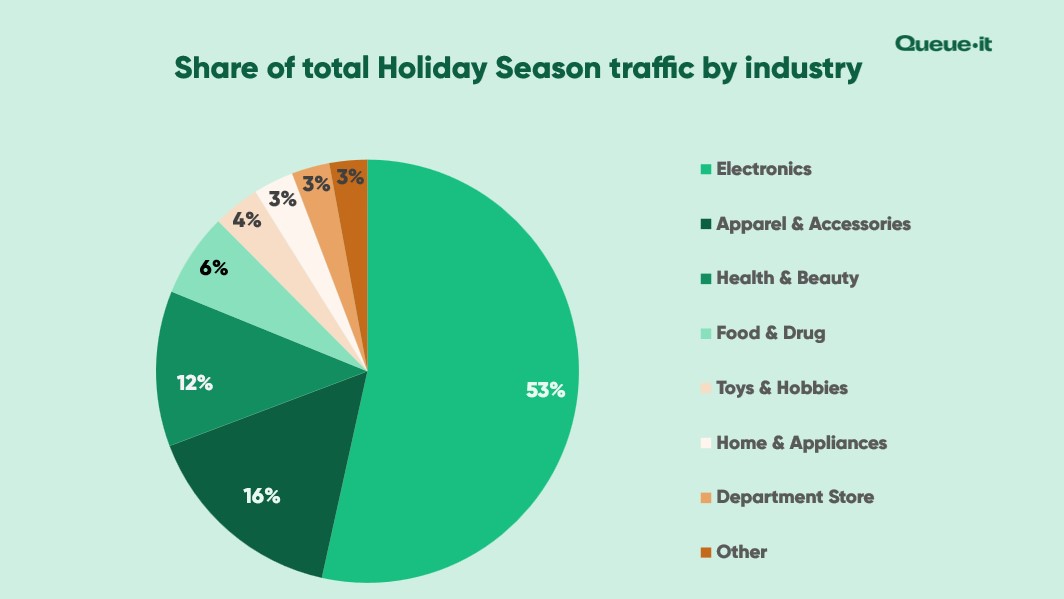
Here’s the traffic breakdown by category:
- Electronics: 53% (1.3 billion visits)
- Apparel & accessories: 16% (386 million visits)
- Health & beauty: 12% (290 million visits)
- Food & drug: 6% (156 million visits)
- Toys & hobbies: 4% (87 million visits)
- Home & appliances: 3% (75 million visits)
- Department store: 3% (71 million visits)
- Other (including jewelry, hardware & home improvement, auto parts & accessories, sporting goods, and more): 3% (71 million visits)
In 2022, Queue-it launched Traffic Insights, a powerful analytics tool that gives customers a visual, actionable overview of waiting room traffic with accurate server-side analytics. Among other information, it allows our customers to view the device breakdown of their visitors and flag suspicious traffic requests.
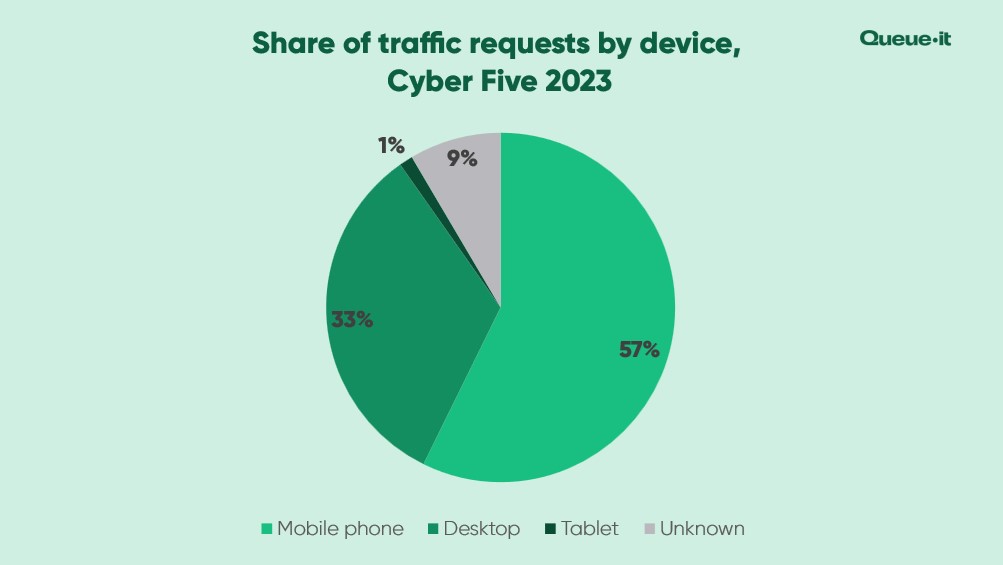
Using Traffic Insights on a subset of Holiday Season retailers, we saw mobile traffic as a portion of overall traffic across Cyber Five increase by 8% YoY.
Three out of every five retail web sessions during Cyber Five 2023 came from mobile devices (57%).
Desktop was the second most popular traffic source, at 33%.
Tablets came in third, making up 1% of traffic.
And almost 1 in 10 sessions (9%) came from an unknown device, which typically occurs if the session comes from a data center, or the shopper is masking their device type with a VPN.
Thanksgiving was the biggest day for mobile traffic, with 66% of all sessions coming from mobile. This tracks with Adobe’s spend data, which also found Thanksgiving was the biggest day of the season for mobile—with 59% of online sales coming through a smartphone.
For contrast, on Cyber Monday, just 50% of traffic came from mobile.
Up to 29% of all Cyber Five traffic in 2023 was “bad traffic”—meaning traffic that came from bots and/or data centers.
This represents a 26% increase compared to 2022.
Data center traffic comes from massive buildings with racks of servers and computing infrastructure. Traffic from a data center rarely comes from a genuine visitor. Most likely it's a bad bot or malicious web scraper running on a rented server, or a visitor trying to mask his or her identity by connecting with a VPN whose server is in the data center.
Unusual traffic requests come from visitors whose behavior or technology setup suggests to Queue-it they're not genuine.
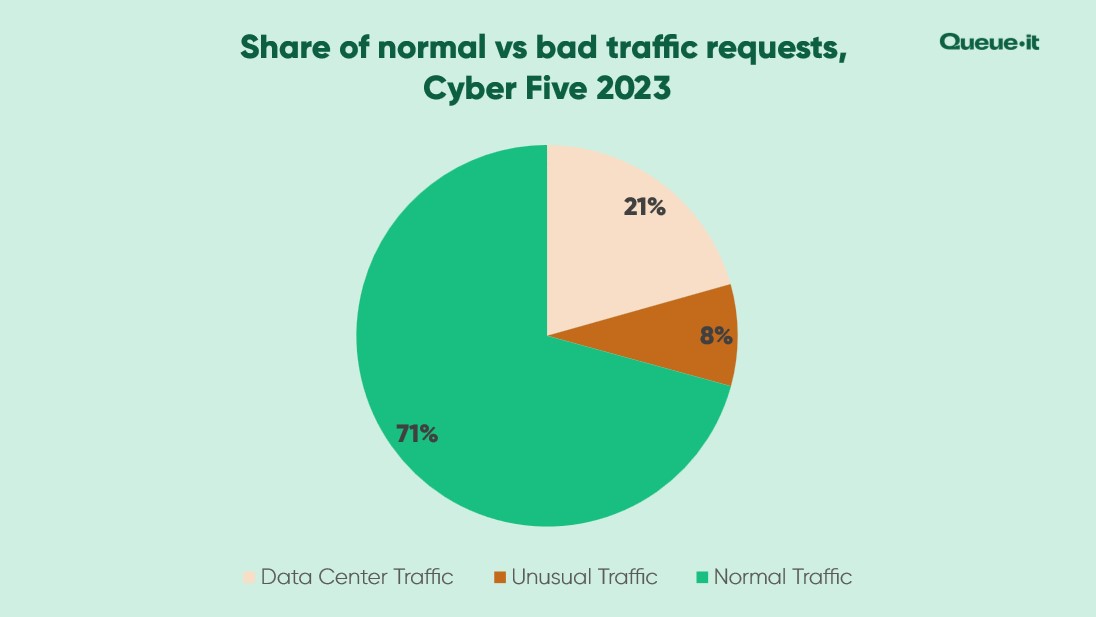
In 2023, 21% of traffic requests came from data centers (up from 17% in 2022), and 8% of traffic was unusual requests (up from 5%). Note that a request can be flagged as both unusual and from a data center, so the range is as low as 21% and as high as 29%.
Data center traffic peaked on Cyber Monday, where it accounted for 28% of all requests.
Bad traffic drives up retailers’ cloud computing costs, distorts conversion rates and other important analytics, and can even crash your site if it comes in too much volume.
Traffic Insights allows Queue-it customers to identify and act on malicious traffic. The retailers who use it get access to detailed, real-time dashboards showing their traffic makeup. They can use these dashboards to get deeper insight and block or challenge suspicious traffic.
RELATED: Traffic Insights: Understand & Act on Your Waiting Room Traffic
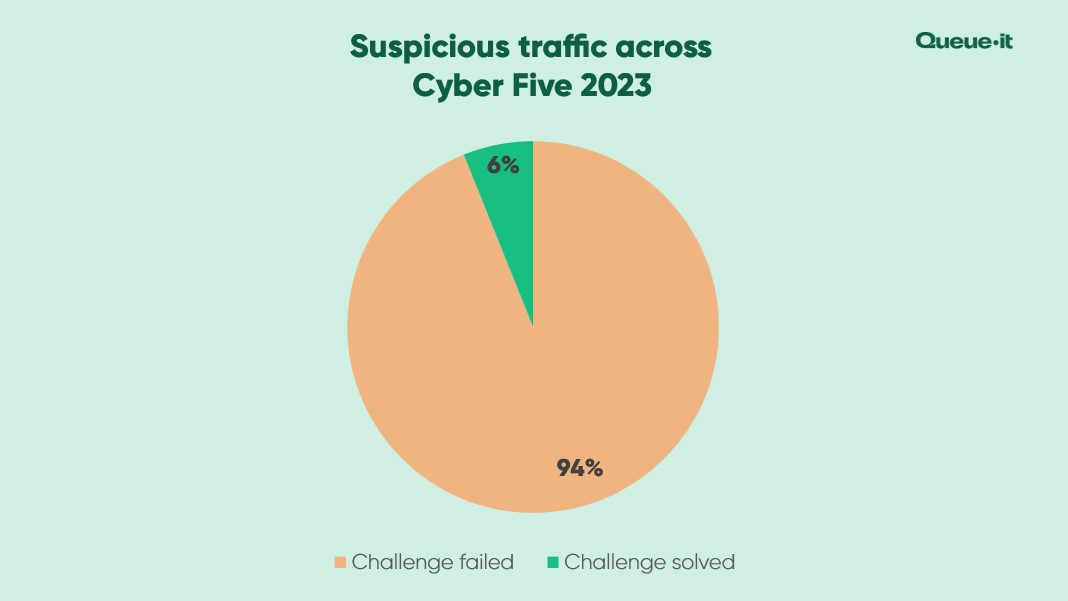
Queue-it’s Anomaly Detection automatically flags suspicious traffic and either hard-blocks it or challenges it depending on how the retailer has set up their bot mitigation.
The challenges include a simple CAPTCHA test or a Proof-of-Work Challenge—which is invisible to human users but creates issues for bots.
Across Cyber Five, 94% of the suspicious traffic Queue-it challenged failed to pass the challenge. That’s almost 3 million bots blocked.
- Mobile is the new normal: Three out of every five visitors to retail sites across Cyber Five came from mobile devices. A mobile-first strategy is now essential to Holiday Season—and ecommerce—success.
- Early access shaped the season: Early and exclusive access is no longer just a trend. It’s become a key retail strategy both for the Holiday Season and throughout the year. The influence of early access was so strong in 2023 that Cyber Five was dethroned as the Holiday Season’s biggest week—with the five days prior surging 41% YoY in traffic. If you want to compete with the big retail players next Holiday Season, know that Black Friday is already too late.
- Preparedness across the season: With traffic the week before Cyber Five surging, online retailers must have their websites prepared for peak traffic earlier and for longer. Traffic on the Friday before Black Friday spiked 63% YoY. On the Monday before Black Friday, it increased 58%. Retailers unprepared for the Holiday Season's new biggest days risk losing key sales and valued customers to site crashes.
- Grinch bots are coming for deals: Almost 30% of retail web sessions across Cyber Five came from bots and/or data centers. Bad traffic like this is no longer something retailers can afford to ignore. It increases costs, complaints, and crashes. Retailers need detailed bot analytics tools like Traffic Insights and bot mitigation tools like Anomaly Detection to keep their site online, and their customers happy.
This report is based on web traffic from a sample of 198 of Queue-it's online retail customers. The retailers are based in 36 countries across 6 continents. All traffic date stamps are based on UTC. Year-over-year comparisons are made with an identical set of 48 retailers who used Queue-it for Holiday Season sales in both 2022 and 2023. In-year comparisons are made with the full data set (198 retailers). The device and traffic type data comes from a subset of retailers using Queue-it's Traffic Insights.