

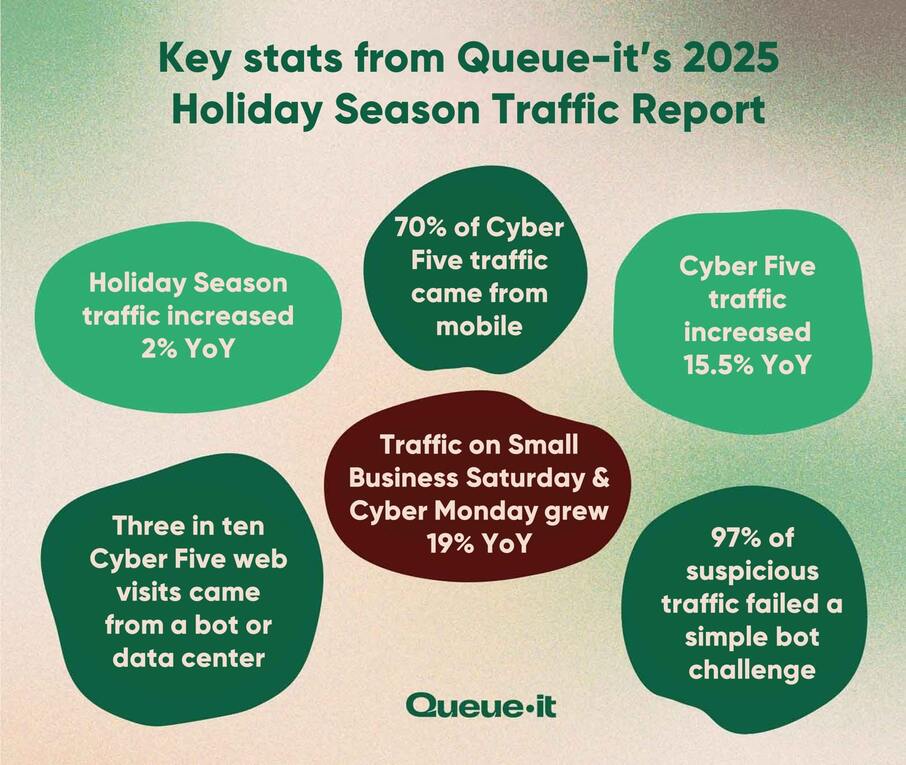
Cyber Five web traffic spiked 15.5%. Black Friday grew 16% to remain the biggest online shopping day worldwide. Seven in ten Cyber Five web visits came from mobile devices, while nearly three in ten originated from bots or data centers. Explore the key statistics and trends revealed by more than 2.4 billion web visits across the 2025 Holiday Season and uncover what they mean for retailers preparing for 2026.
The 2025 Holiday Season confirmed a shift that first emerged in 2024: early holiday shopping has plateaued, while demand has concentrated around the biggest days of the season.
After years of earlier promotions and extended sales periods, this year’s data shows consumer shopping patterns stabilizing. Traffic remained elevated across the season, but shoppers waited for the biggest days and deals, with demand surging throughout Cyber Five.
Across 138 global retailers, Queue-it tracked more than 2.4 billion web visits between Nov. 1 and Dec. 19, with traffic increasing 2% year-over-year (YoY). Cyber Five delivered its biggest growth in years, with sharper traffic spikes, heavier mobile usage, and continued pressure from non-human traffic—raising the stakes for performance, availability, and fairness on key days.
Queue-it provides a virtual waiting room solution that helps retailers control traffic to their websites and apps, preventing crashes and blocking bots. Although visitors only see a waiting room page when a website or app is at risk of traffic overload, Queue-it has insight into visitor requests while the virtual waiting room is in place.
Note: All year-over-year (YoY) comparisons are made with a control group of retailers Queue-it worked with in both 2024 and 2025. In-year comparisons are made with the full list of 138 retailers.
Table of contents
- Holiday Season traffic grows 2% YoY
- Cyber Five sees 15.5% growth—its biggest in years
- Black Friday biggest day of the season, growing 16% YoY
- Black Friday traffic almost 2x average October Friday
- Electronics remains top category with half of all traffic
- 70% of Cyber Five traffic from mobile devices
- 28% of Cyber Five traffic from bots or data centers
- 97% of suspicious Cyber Five traffic failed a simple bot challenge
- 21 million visitors queued in virtual waiting rooms
- Key takeaways for online retailers for 2026 Holiday Season
- Methodology
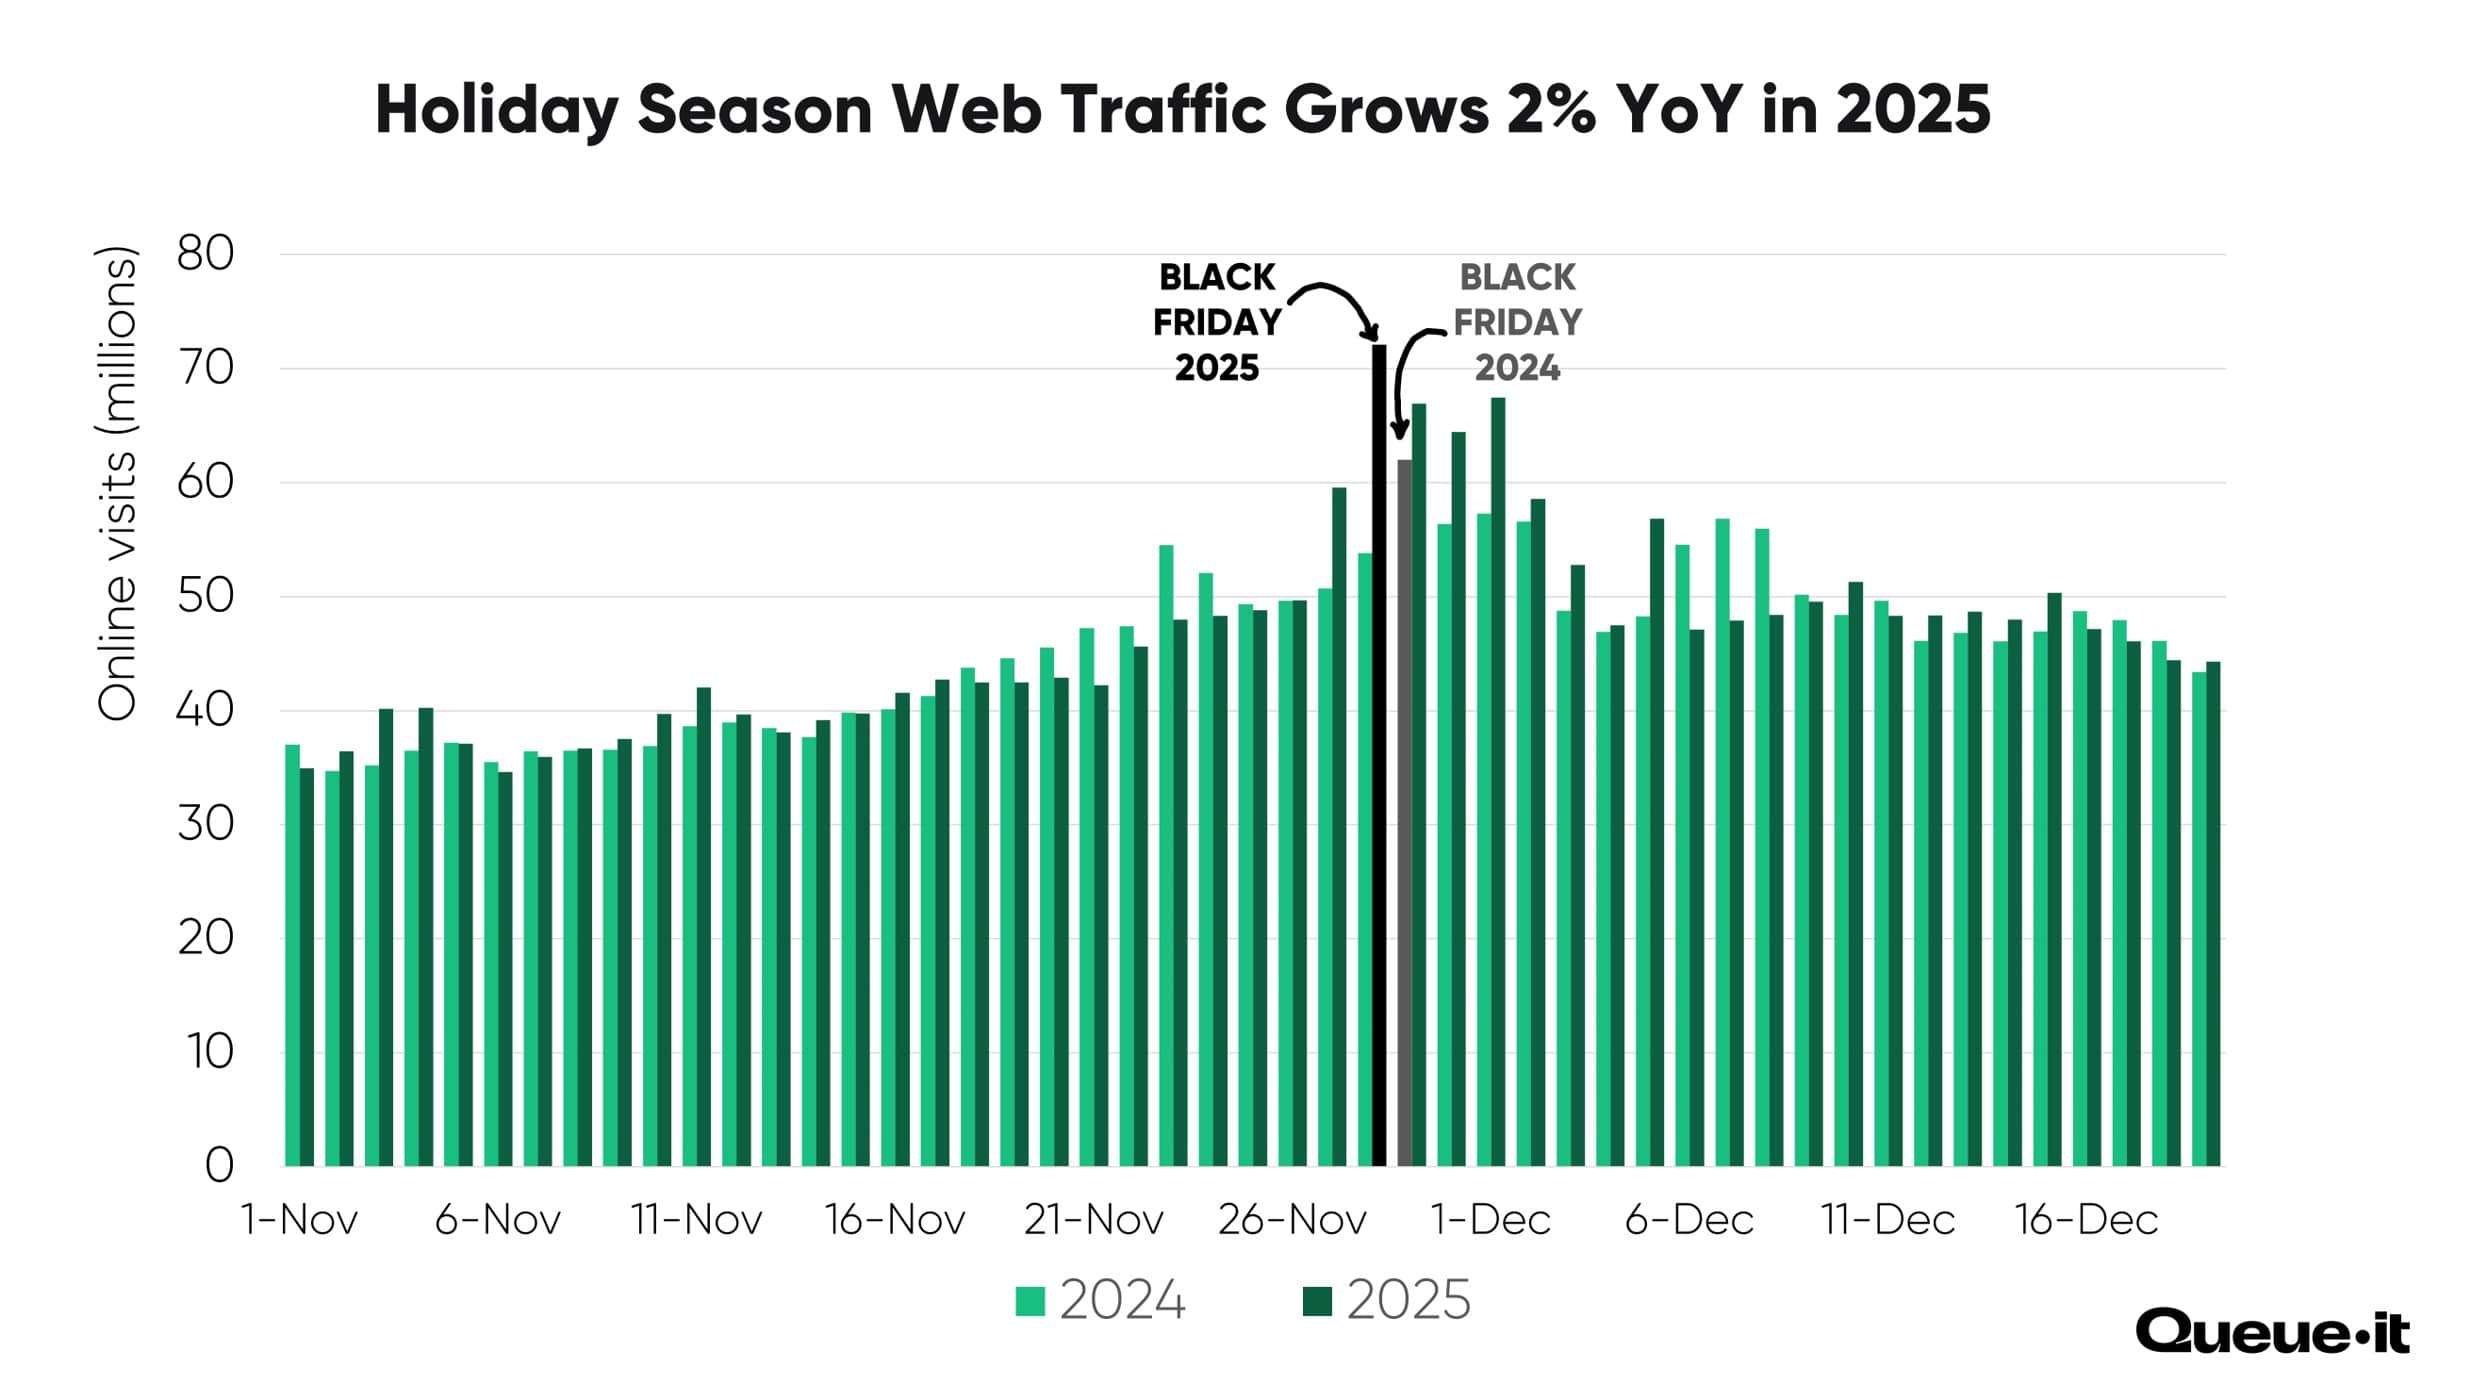
Across the same subset of retailers, traffic from Nov. 1 to Dec. 19 increased by 1.9% year-over-year, from 2.24 billion web visits in 2024, to 2.28 billion web visits in 2025. That’s an increase of over 42 million web visits across the 49 days, less than a million per day.
Since Queue-it started reporting on Holiday Season data in 2019, we’ve observed a continual trend towards traffic spiking earlier in the season, with many retailers now kicking off “Black Friday” sales about a month early, in October.
But consumer appetite for these early shopping events shifted last year, with Holiday Season traffic actually dropping in the first half of November, then increasing dramatically later in the Season.
In 2025, we see a Holiday Season that looks very much like 2024: with elevated but consistent traffic throughout the first half of November, a steady increase in the lead-up to Cyber Five, then a big surge during Cyber Five.

Black Friday 2025 was late in the month (Nov. 28), which may have contributed to this later spending push.
But the data also tracks with theories that consumer interest in earlier Holiday Season shopping has plateaued, with consumers wising up to the fact that early deals typically stick around (and sometimes even improve) late into the season.
In 2025, Cyber Five retail web traffic increased by 15.5% YoY, from 286 million web visits to over 330 million.
Each day from Thanksgiving through to Cyber Monday saw larger traffic volumes in 2025 compared to 2024, with a huge 19% increase on both Small Business Saturday and Cyber Monday.

Here’s the year-over-year breakdown of the days:
- Thanksgiving: +10.7%
- Black Friday: +16.3%
- Small Business Saturday: +18.7%
- Cyber Sunday: +12.5%
- Cyber Monday: +19.2%
This Cyber Five surge is similar to what we saw in the 2024 Holiday Season, where lower traffic earlier in the month saw a return to huge traffic increases across Cyber Five.
RELATED: Avoid Ecommerce Website Crashes with a Virtual Waiting Room
For the second year in a row, traffic actually dropped year-over-year during the week leading up to Cyber Five (by 7.2%), before dramatically increasing on each of the five biggest shopping days (by 15.5%). This signals that consumers are waiting for the Holiday Season's biggest days (and discounts) to do the bulk of their shopping.
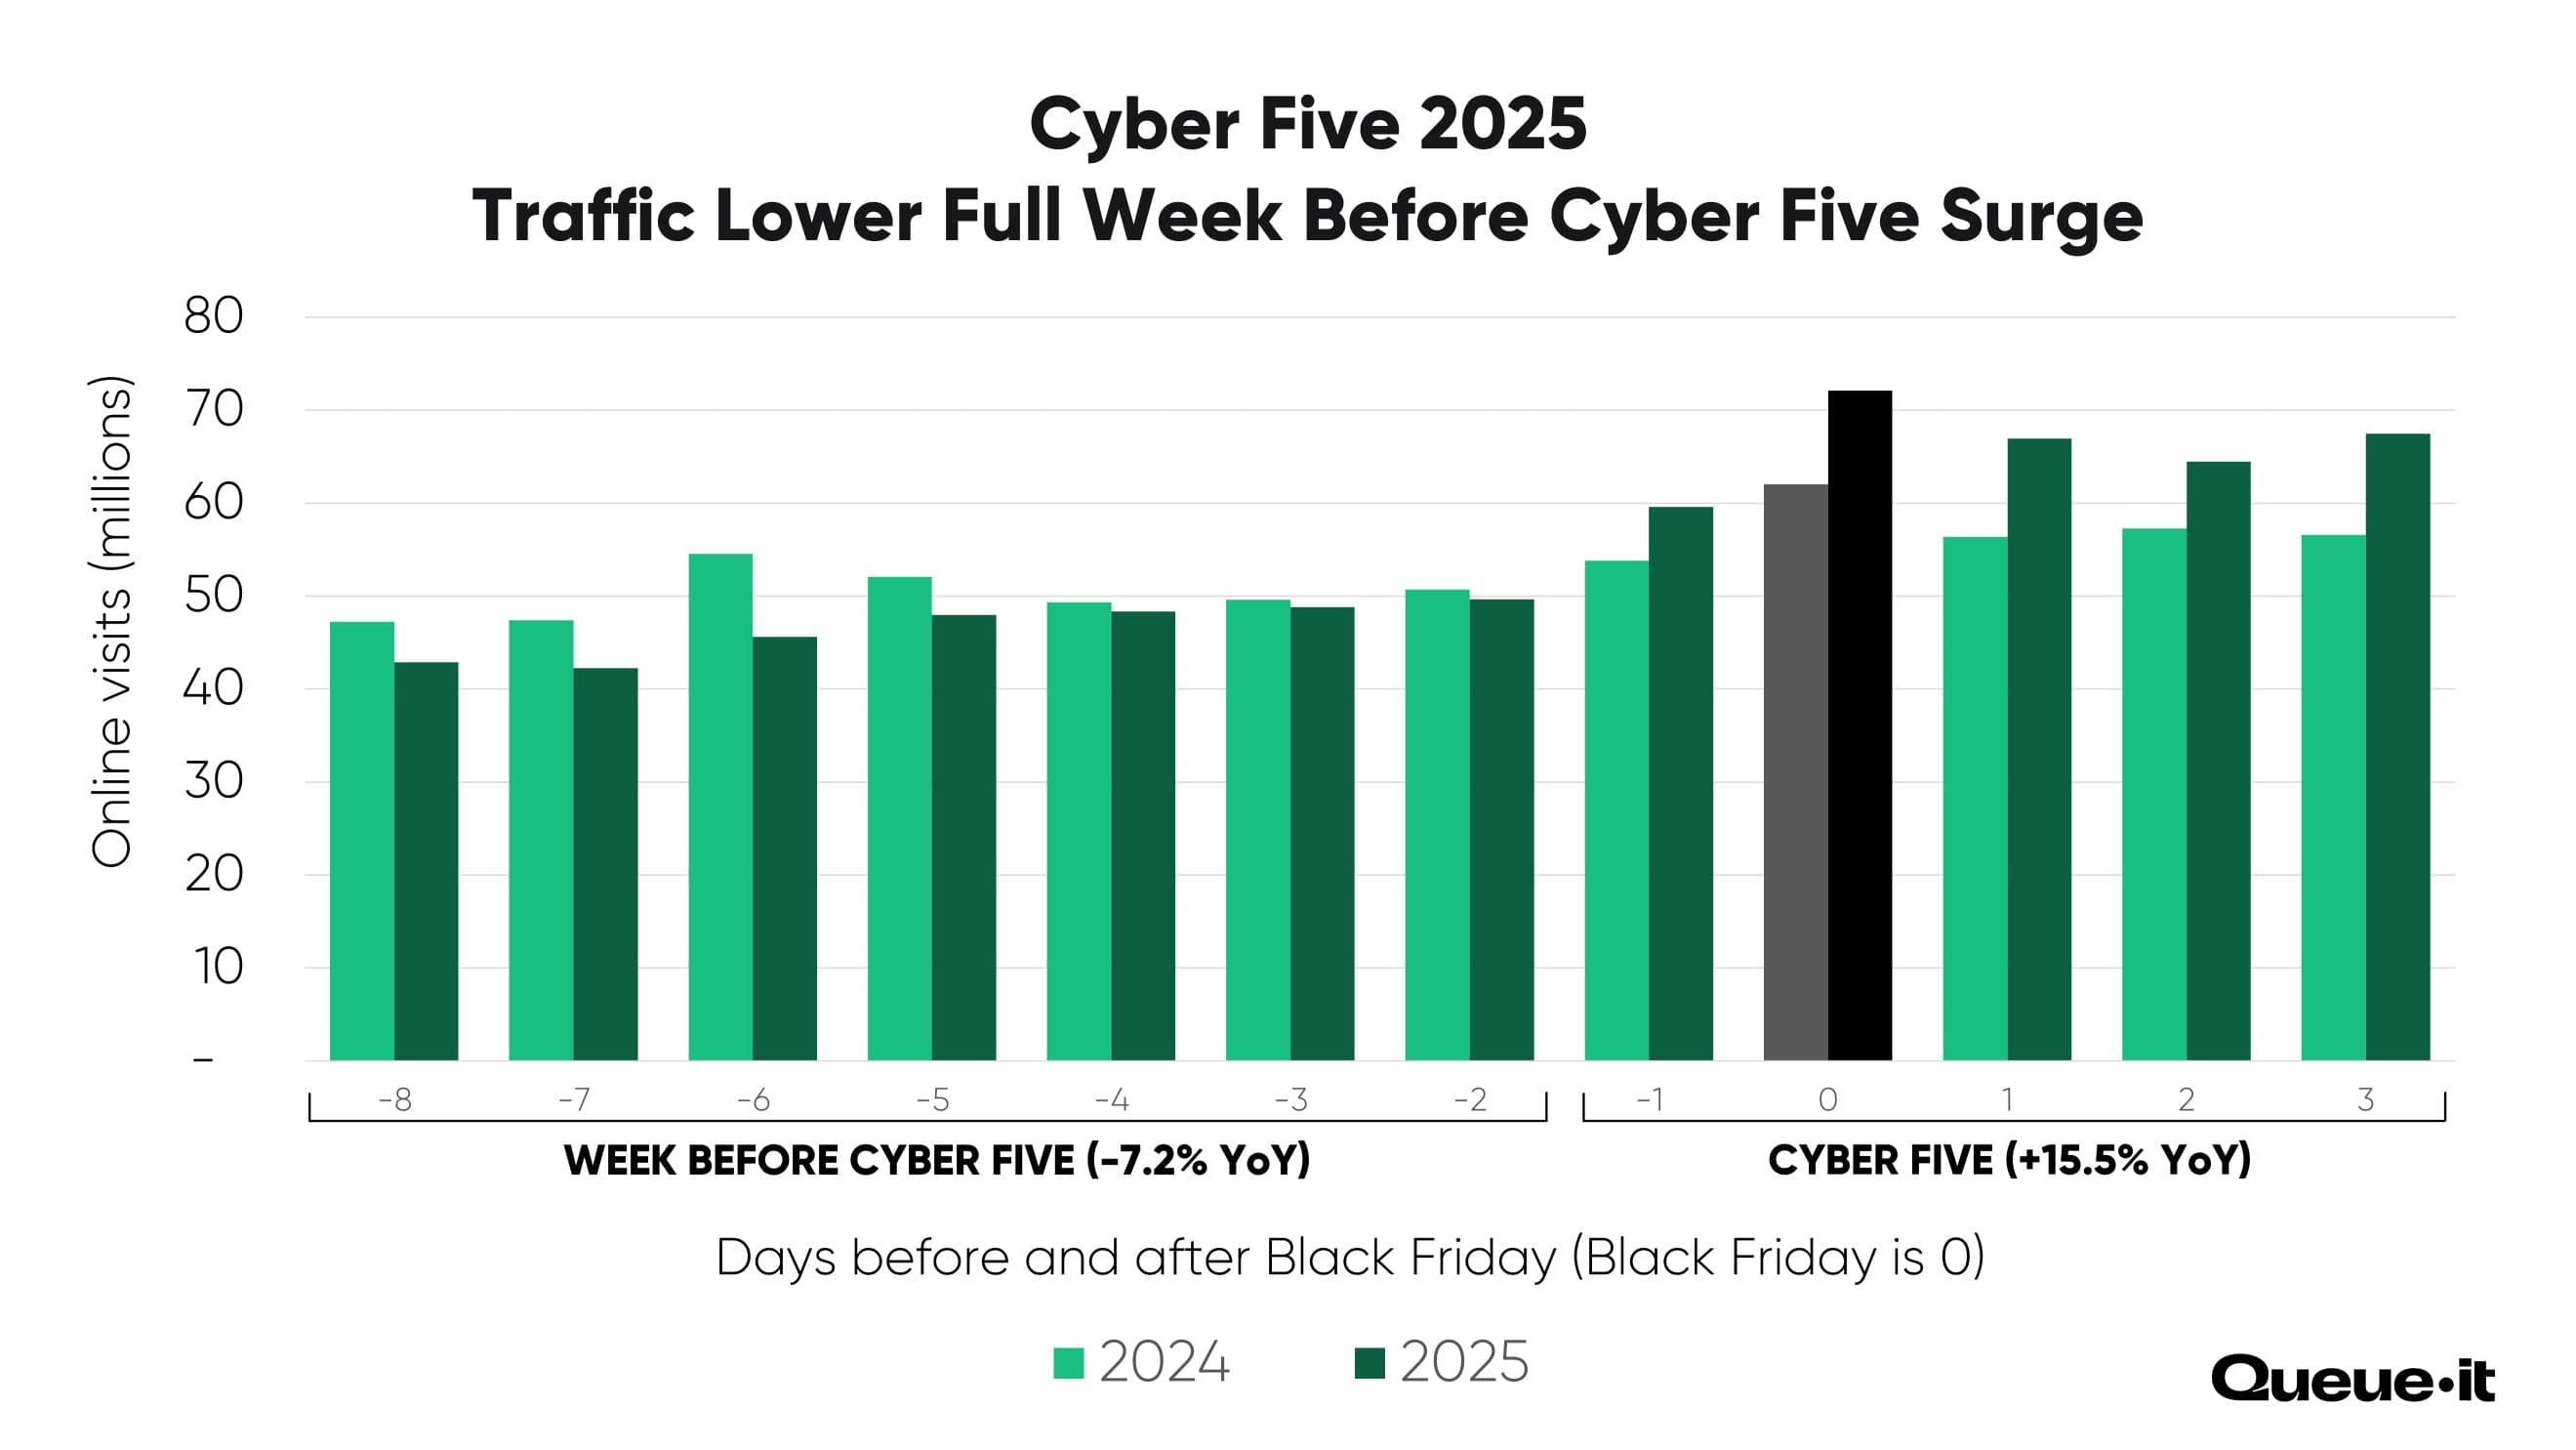
Between Thanksgiving Thursday and Cyber Monday, Queue-it's full retail sample recorded over 350 million retail web visits. That’s a quarter (24.5%) of traffic across the whole month of November (1.4 billion), hitting retail sites across just five key days.
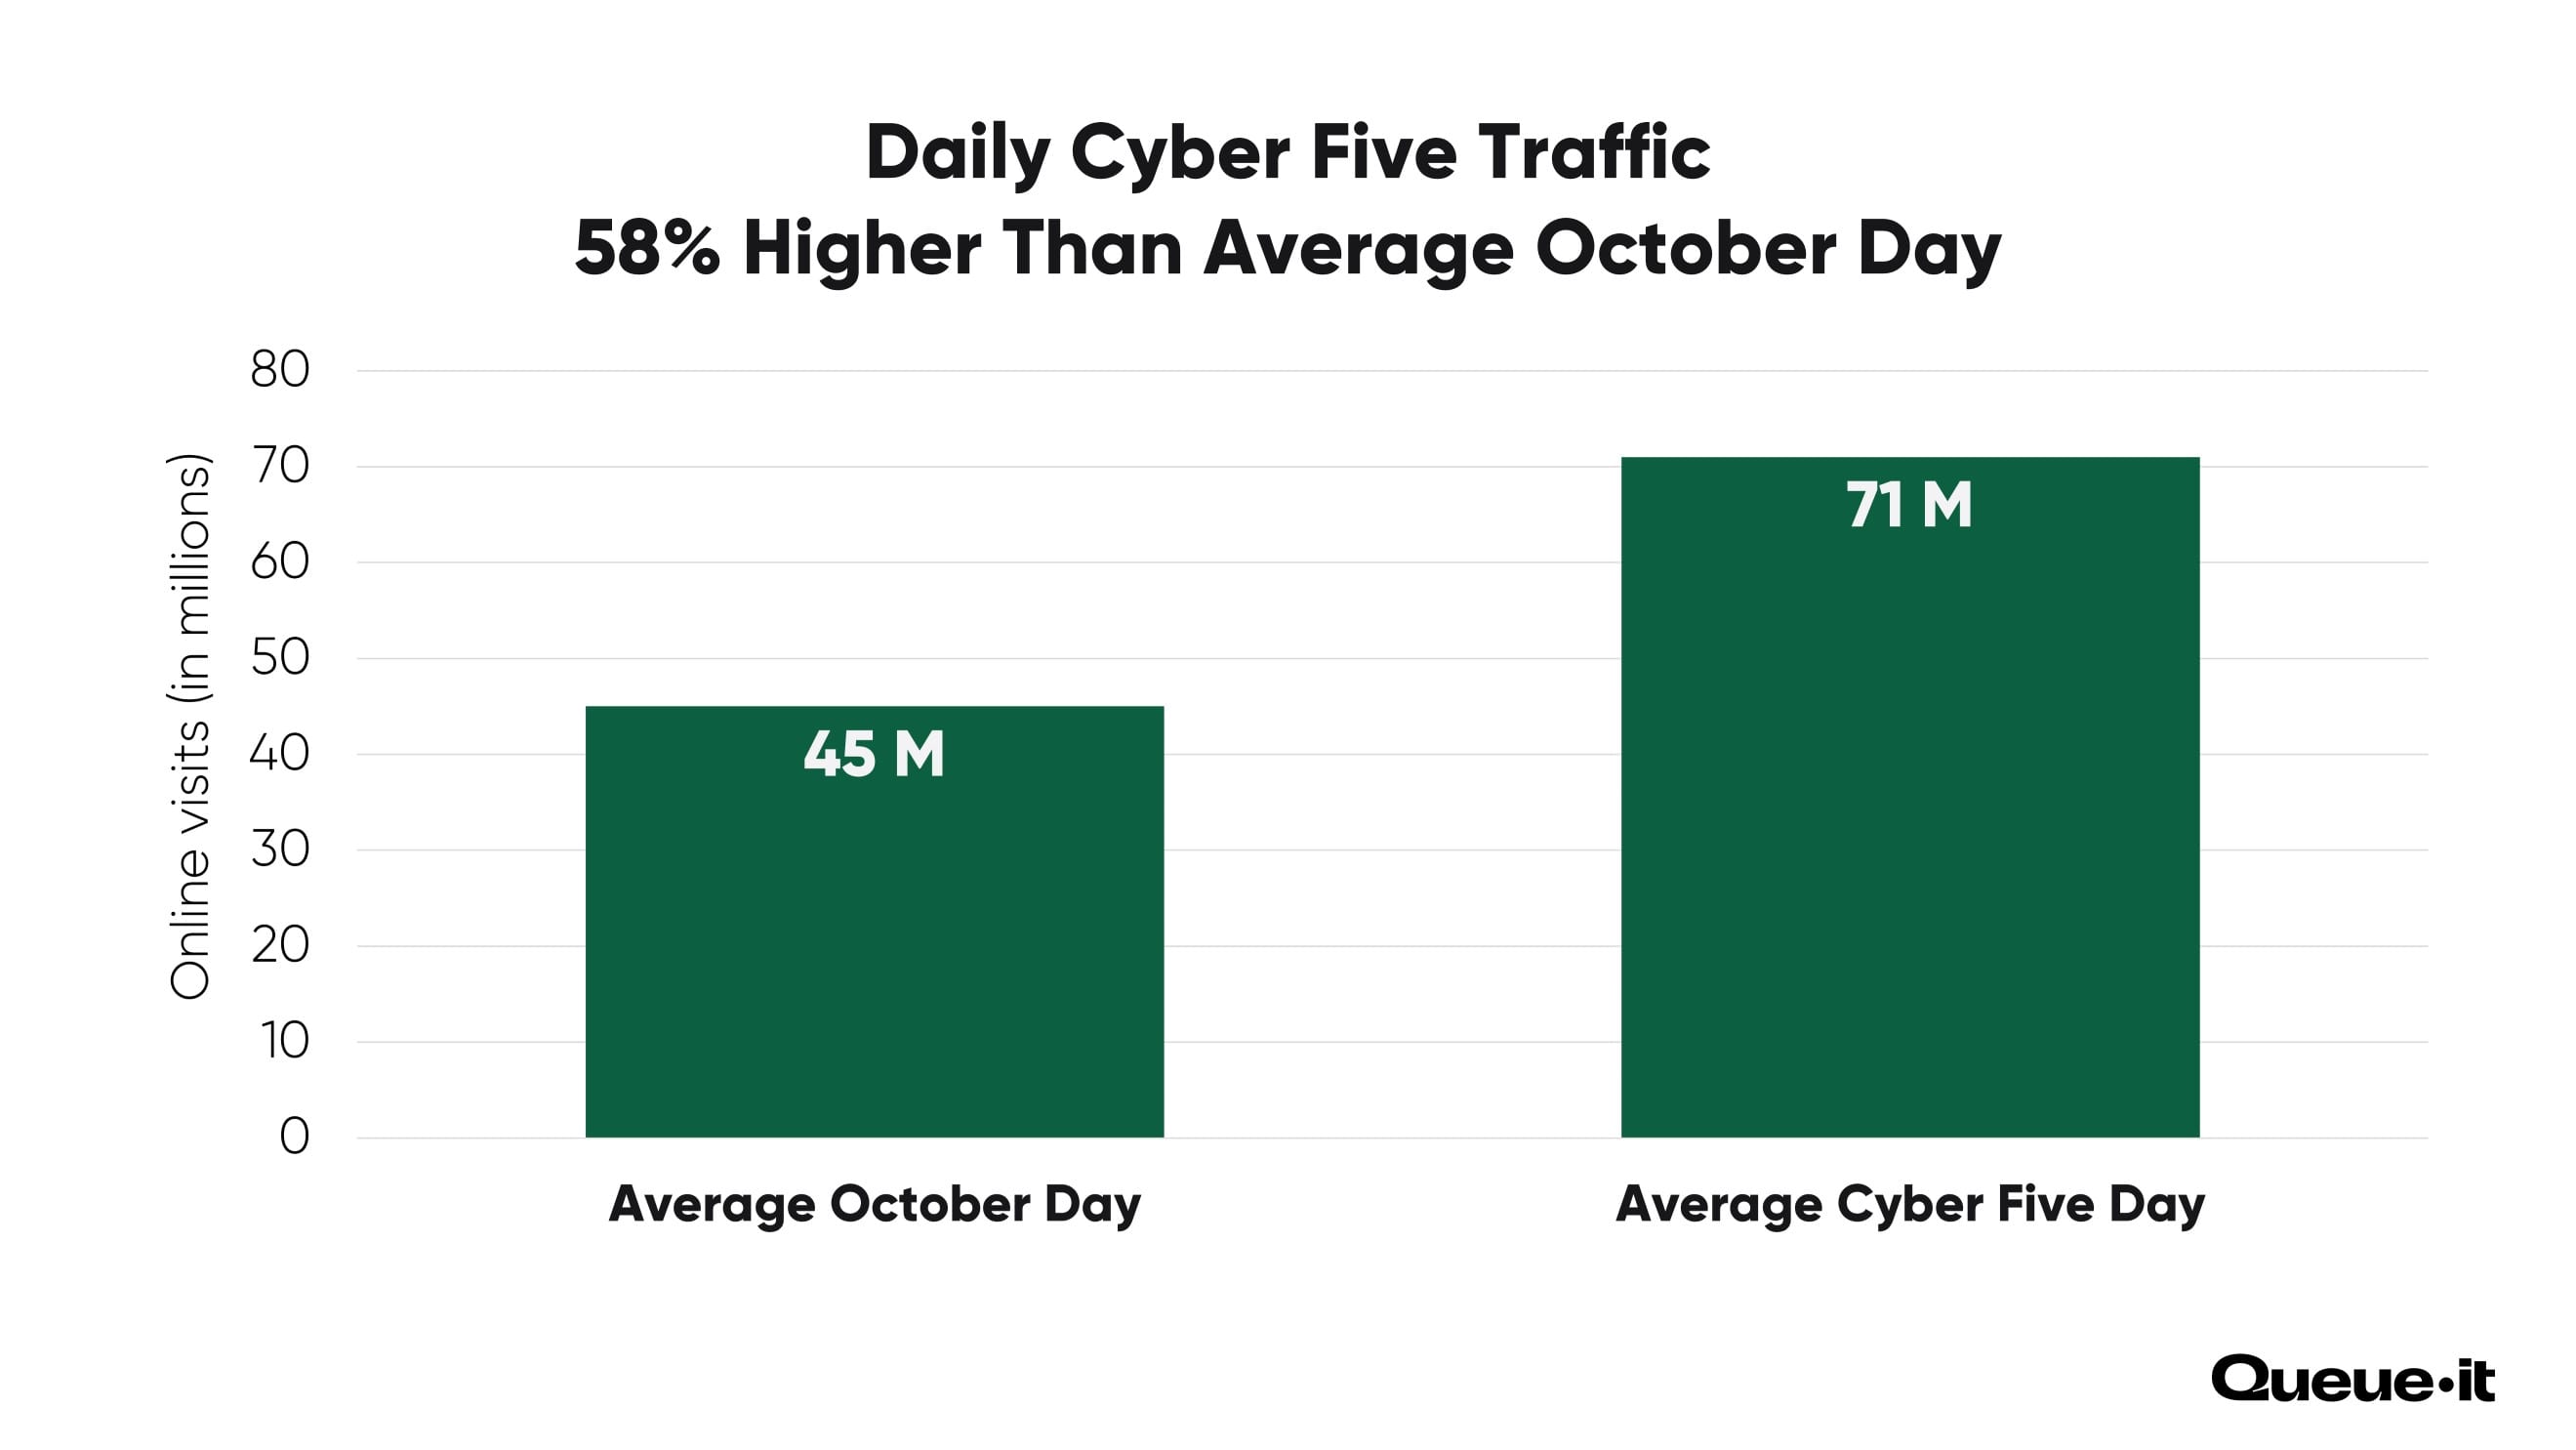
With an average of 71 million daily web visits, Cyber Five traffic was 58% higher than the typical October day (45 million), showing just how elevated retail web traffic is during this period.
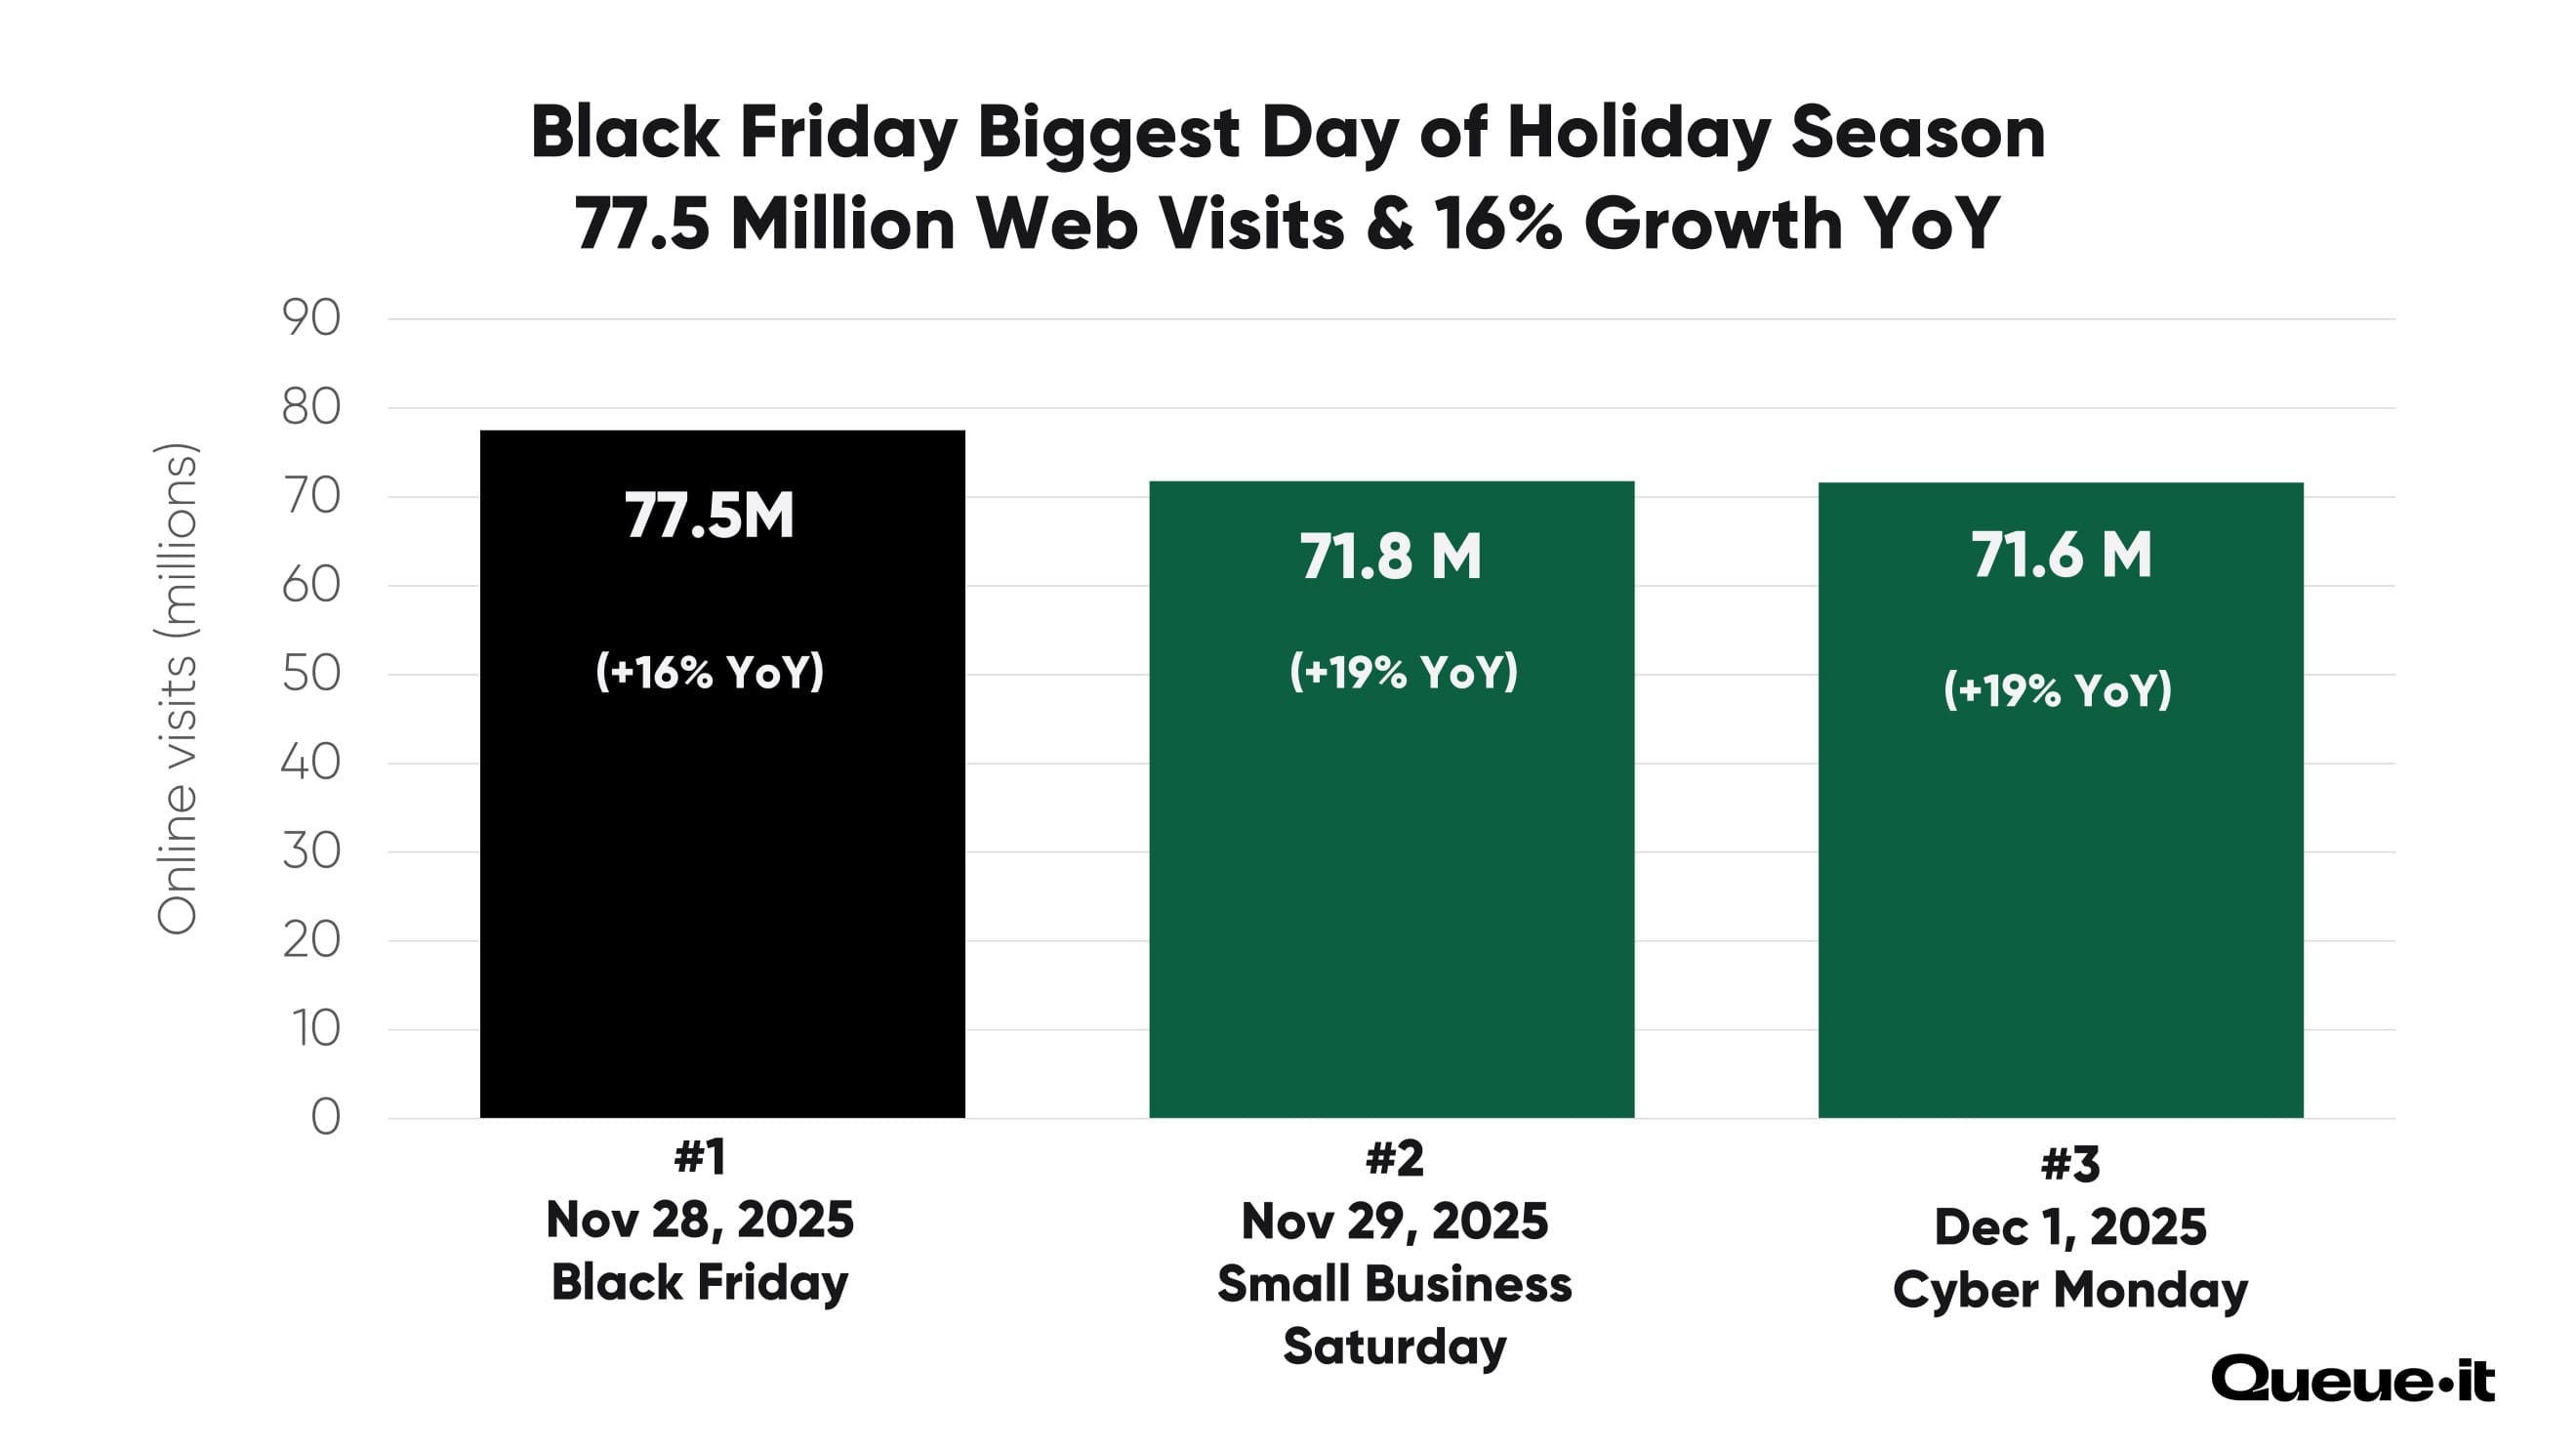
For the sixth year in a row, Black Friday was retail’s biggest day for online traffic, with 77.5 million visitors passing through Queue-it’s systems on the day, up 16% YoY.
It’s the biggest Black Friday online traffic we’ve seen since the 2020 Holiday Season, when COVID restrictions saw ecommerce activity surge.
But the other Cyber Five days weren’t far behind. Small Business Saturday took second place with 71.8 million web visits, and Cyber Monday came closely behind with 71.6 million. Both days increased by an impressive 19% YoY, and were separated by only 200,000 web visits.
Note: Total traffic from the full dataset (138 retailers), while year-over-year comparison from retailers who used Queue-it in both 2024 & 2025 (106 retailers).
Top three biggest days of the 2025 Holiday Season were:
- Black Friday: 77.5M (+16.3% YoY)
- Small Business Saturday: 71.8M (+18.7% YoY)
- Cyber Monday: 71.6M (+19.2%)
U.S. readers may be surprised to see Black Friday and Small Business Saturday traffic exceeding that of Cyber Monday, which was the biggest day of online shopping in U.S. history in terms of sales.
But Queue-it’s dataset comes from retailers across the globe, including many countries in which Black Friday sales are far more common than Cyber Monday sales. While 94% of U.S. consumers are aware of Cyber Monday, only 82% of consumers globally know of the shopping holiday. And in countries like France and Brazil, less than 50% of consumers say they’re aware of Cyber Monday.
With that being said, when we filter for only U.S. retailers, Black Friday still leads Cyber Monday in 2025 by 3.5%.
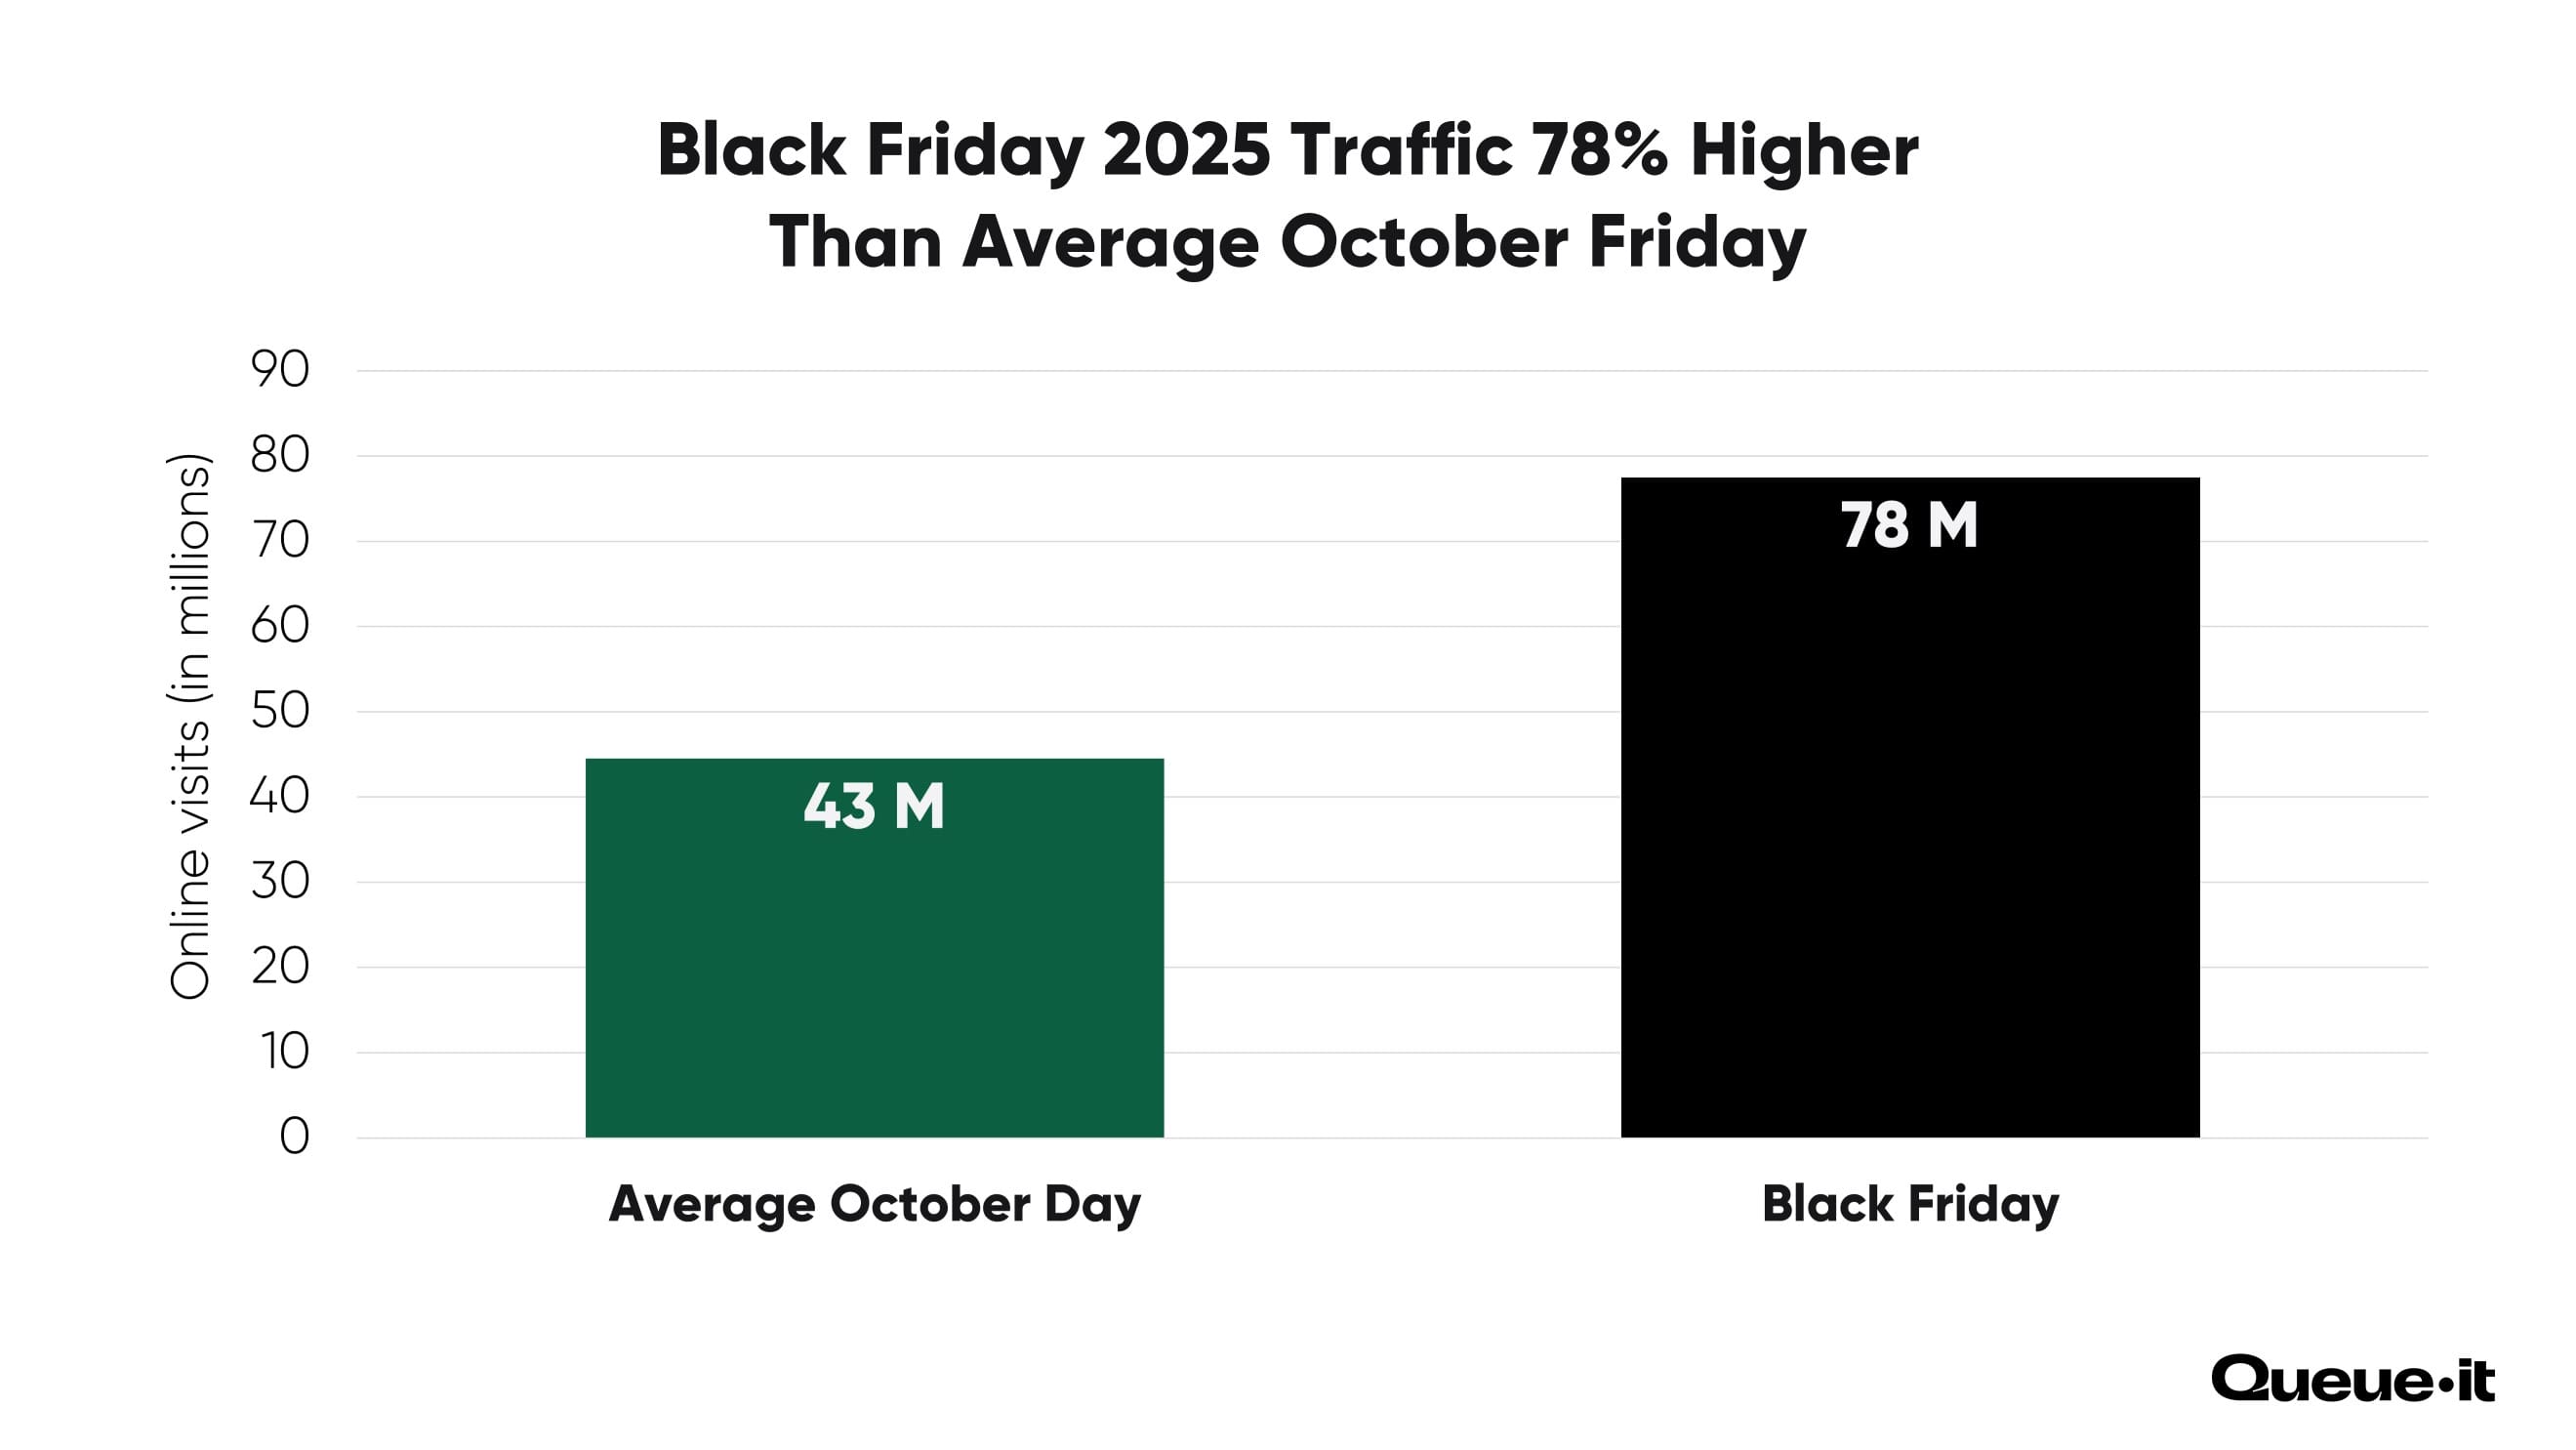
Black Friday 2025 saw six million more web visits than any other day across the Holiday Season. The 77.5 million web visits Black Friday drew in was almost double (+78%) that of an average October Friday (43.5 million web visits).
The continued dominance of Black Friday and rise of Cyber Five show that major traffic spikes on the Holiday Season’s key days aren’t going anywhere. This year’s Holiday Season rush surge saw crashes and issues for major retail websites across the globe, including Best Buy and Target.
And website crashes weren’t the only problem high demand caused across the Holiday Season. Customers on social media complained of cancelled orders of oversold inventory at Abercrombie and Fitch, Good Smile Company, and Shein. Overselling like this typically occurs when retailers are selling items faster than their database and inventory management systems can keep up.
RELATED: Overselling: Why Ecommerce Sites Oversell & How to Prevent it
For the retail customers in this report, however, website crashes and overselling weren’t a problem. With Queue-it’s virtual waiting room in place, these retailers controlled extreme traffic spikes, ensuring the flow of visitors to their website or checkout never exceeded what their systems could handle.
Break Black Friday sales records without breaking your site

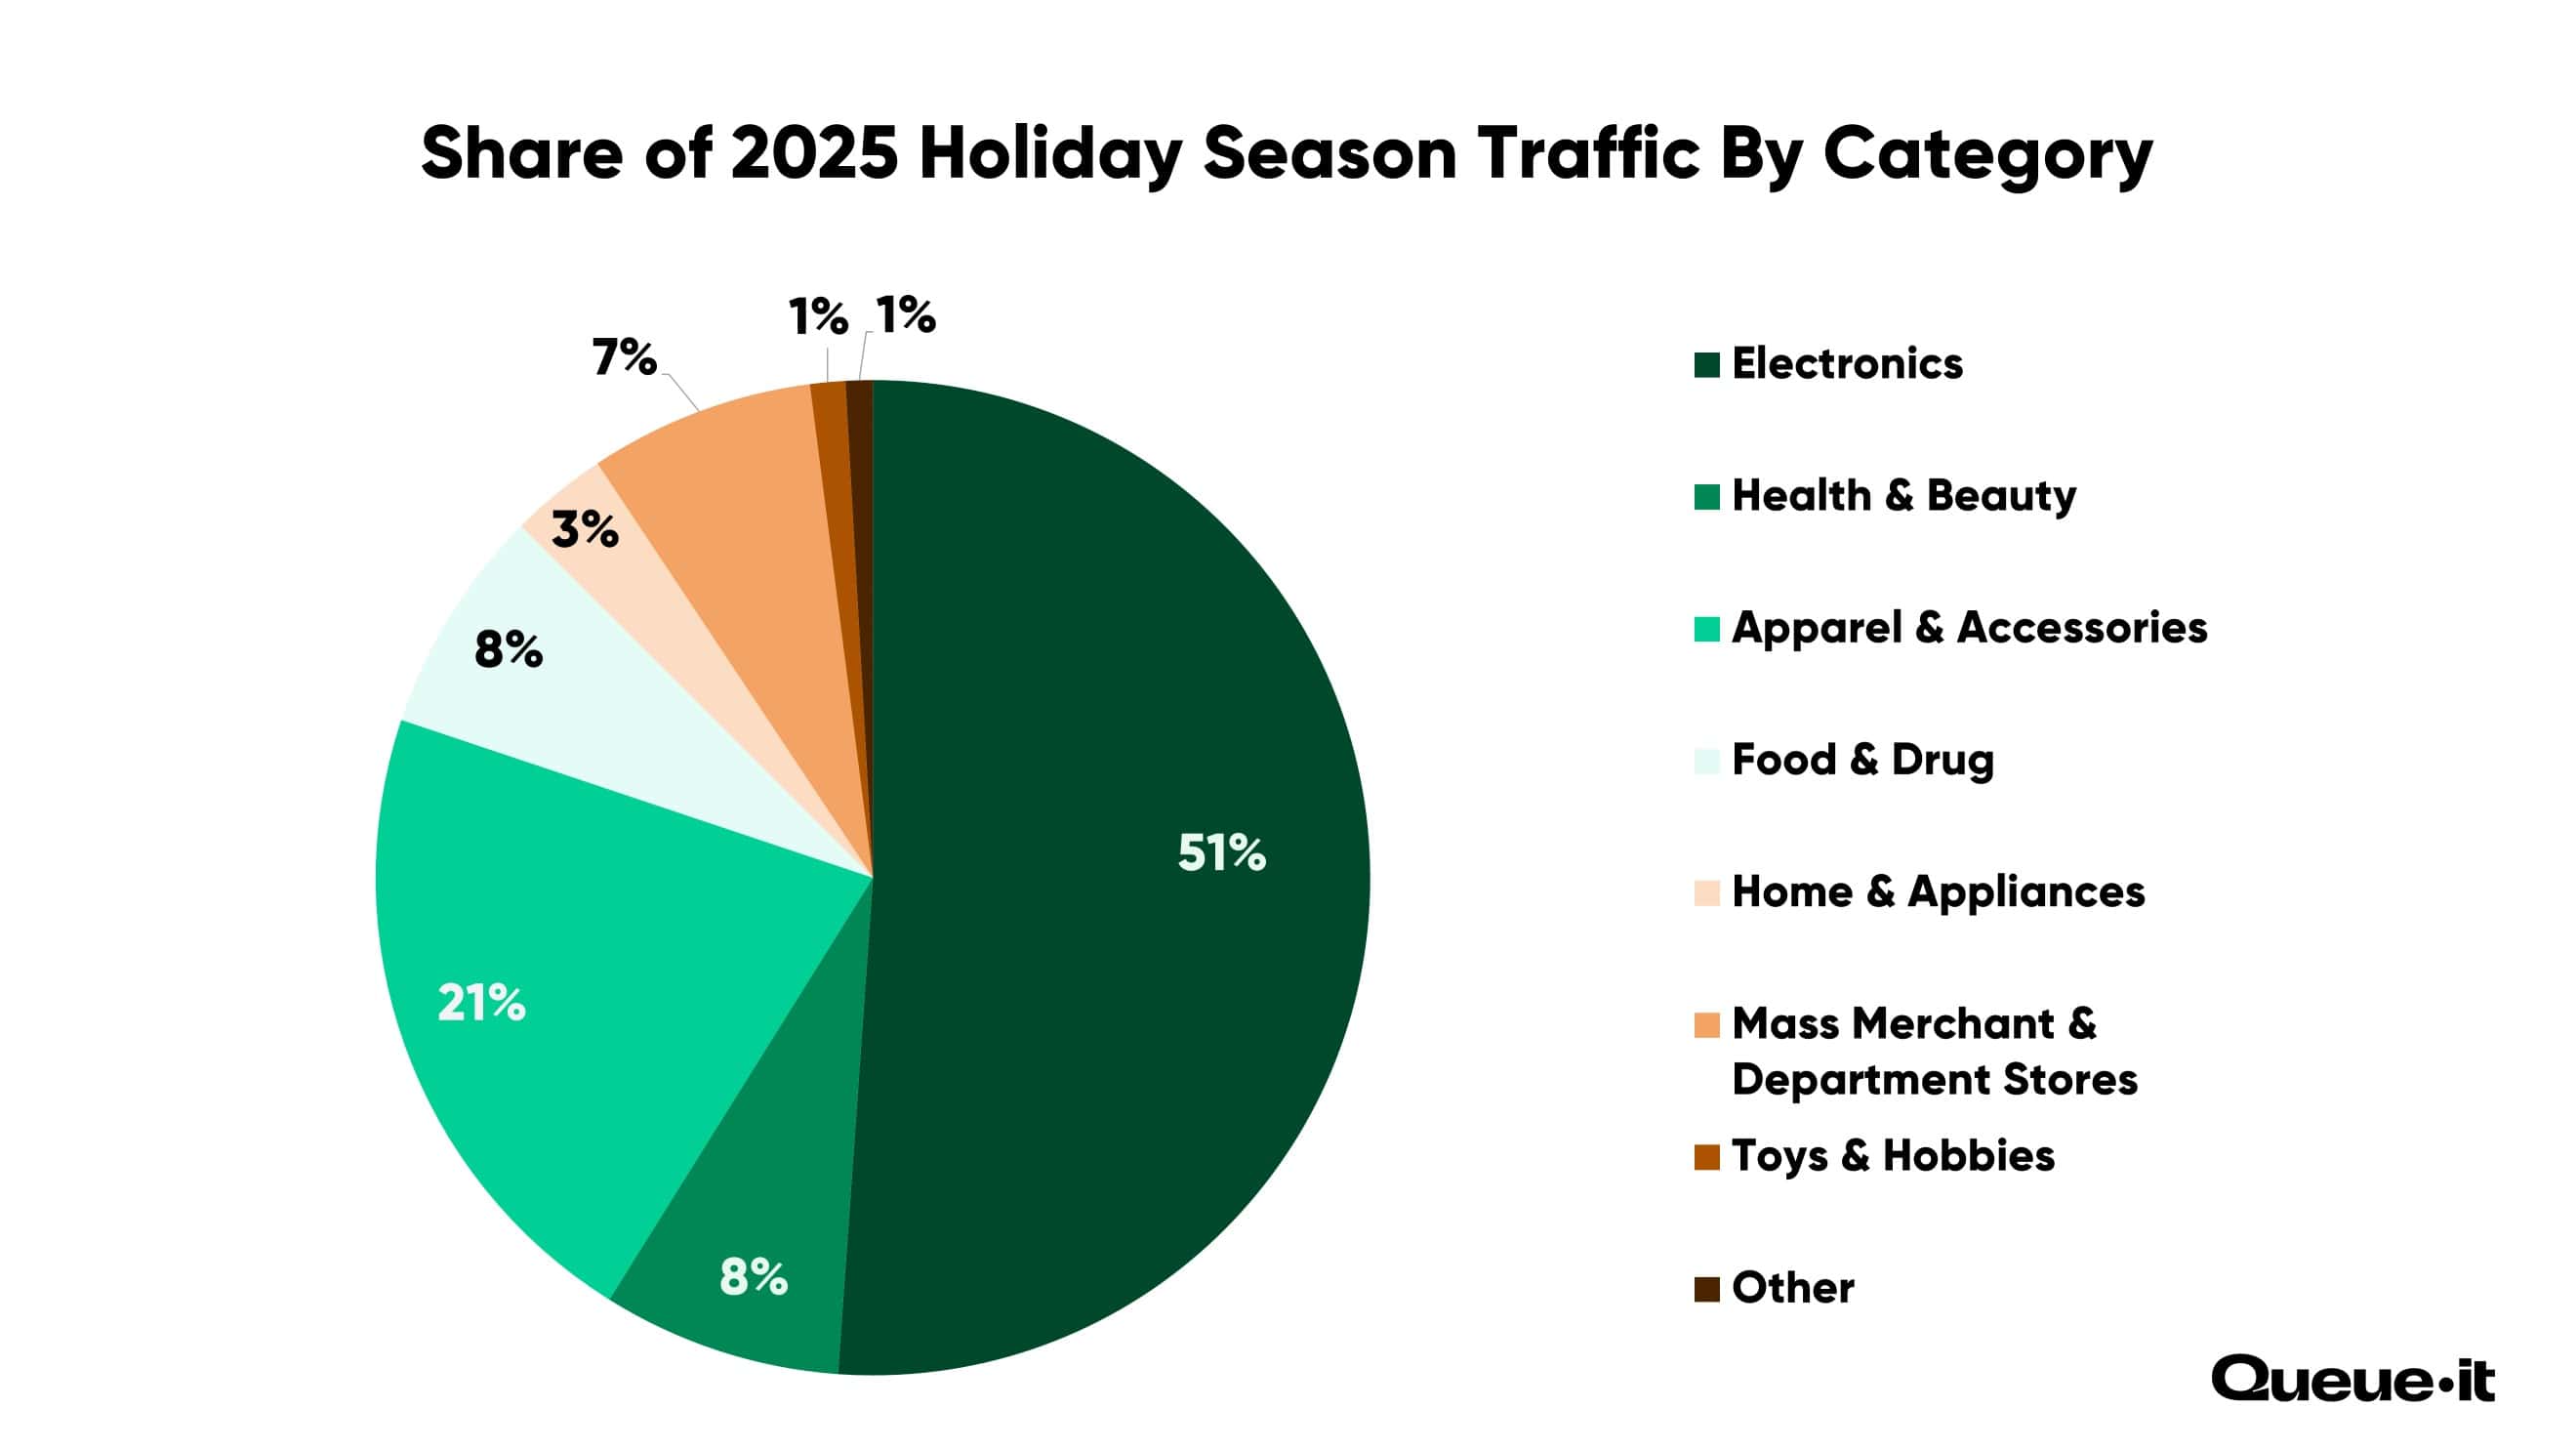
For the sixth year in a row, electronics retailers took the largest share of Holiday Season web traffic in our sample, accounting for over a billion web visits, or half (51%) of our total sample, down from 60% in 2024.
Apparel & Accessories (523 million) overtook Health & Beauty (192 million) in 2025 for the second spot.
Here’s the traffic breakdown by category:
- Electronics: 51% (1.26 billion web visits)
- Apparel & Accessories: 21% (523 million web visits)
- Health & Beauty: 8% (192 million web visits)
- Food & Drug: 8% (181 million web visits)
- Mass Merchant & Department Stores: 7% (180 million web visits)
- Home & Appliances: 3% (78 million web visits)
- Toys & Hobbies: 1% (28 million web visits)
- Other (including Sporting Goods, Hardware & Home Improvement, Auto Parts & Accessories, and more): 1% (22 million web visits)
In 2025, 70% of all Cyber Five retail web visits came from mobile devices, up 9% YoY. This is the fourth consecutive year we've seen growth in mobile traffic.
The rise in mobile traffic came at the expense of Desktop traffic, which fell from 26% last year to 20% this year; as well as tablet traffic, which dropped from 1% to roughly 0.35%—falling off our device type chart altogether.
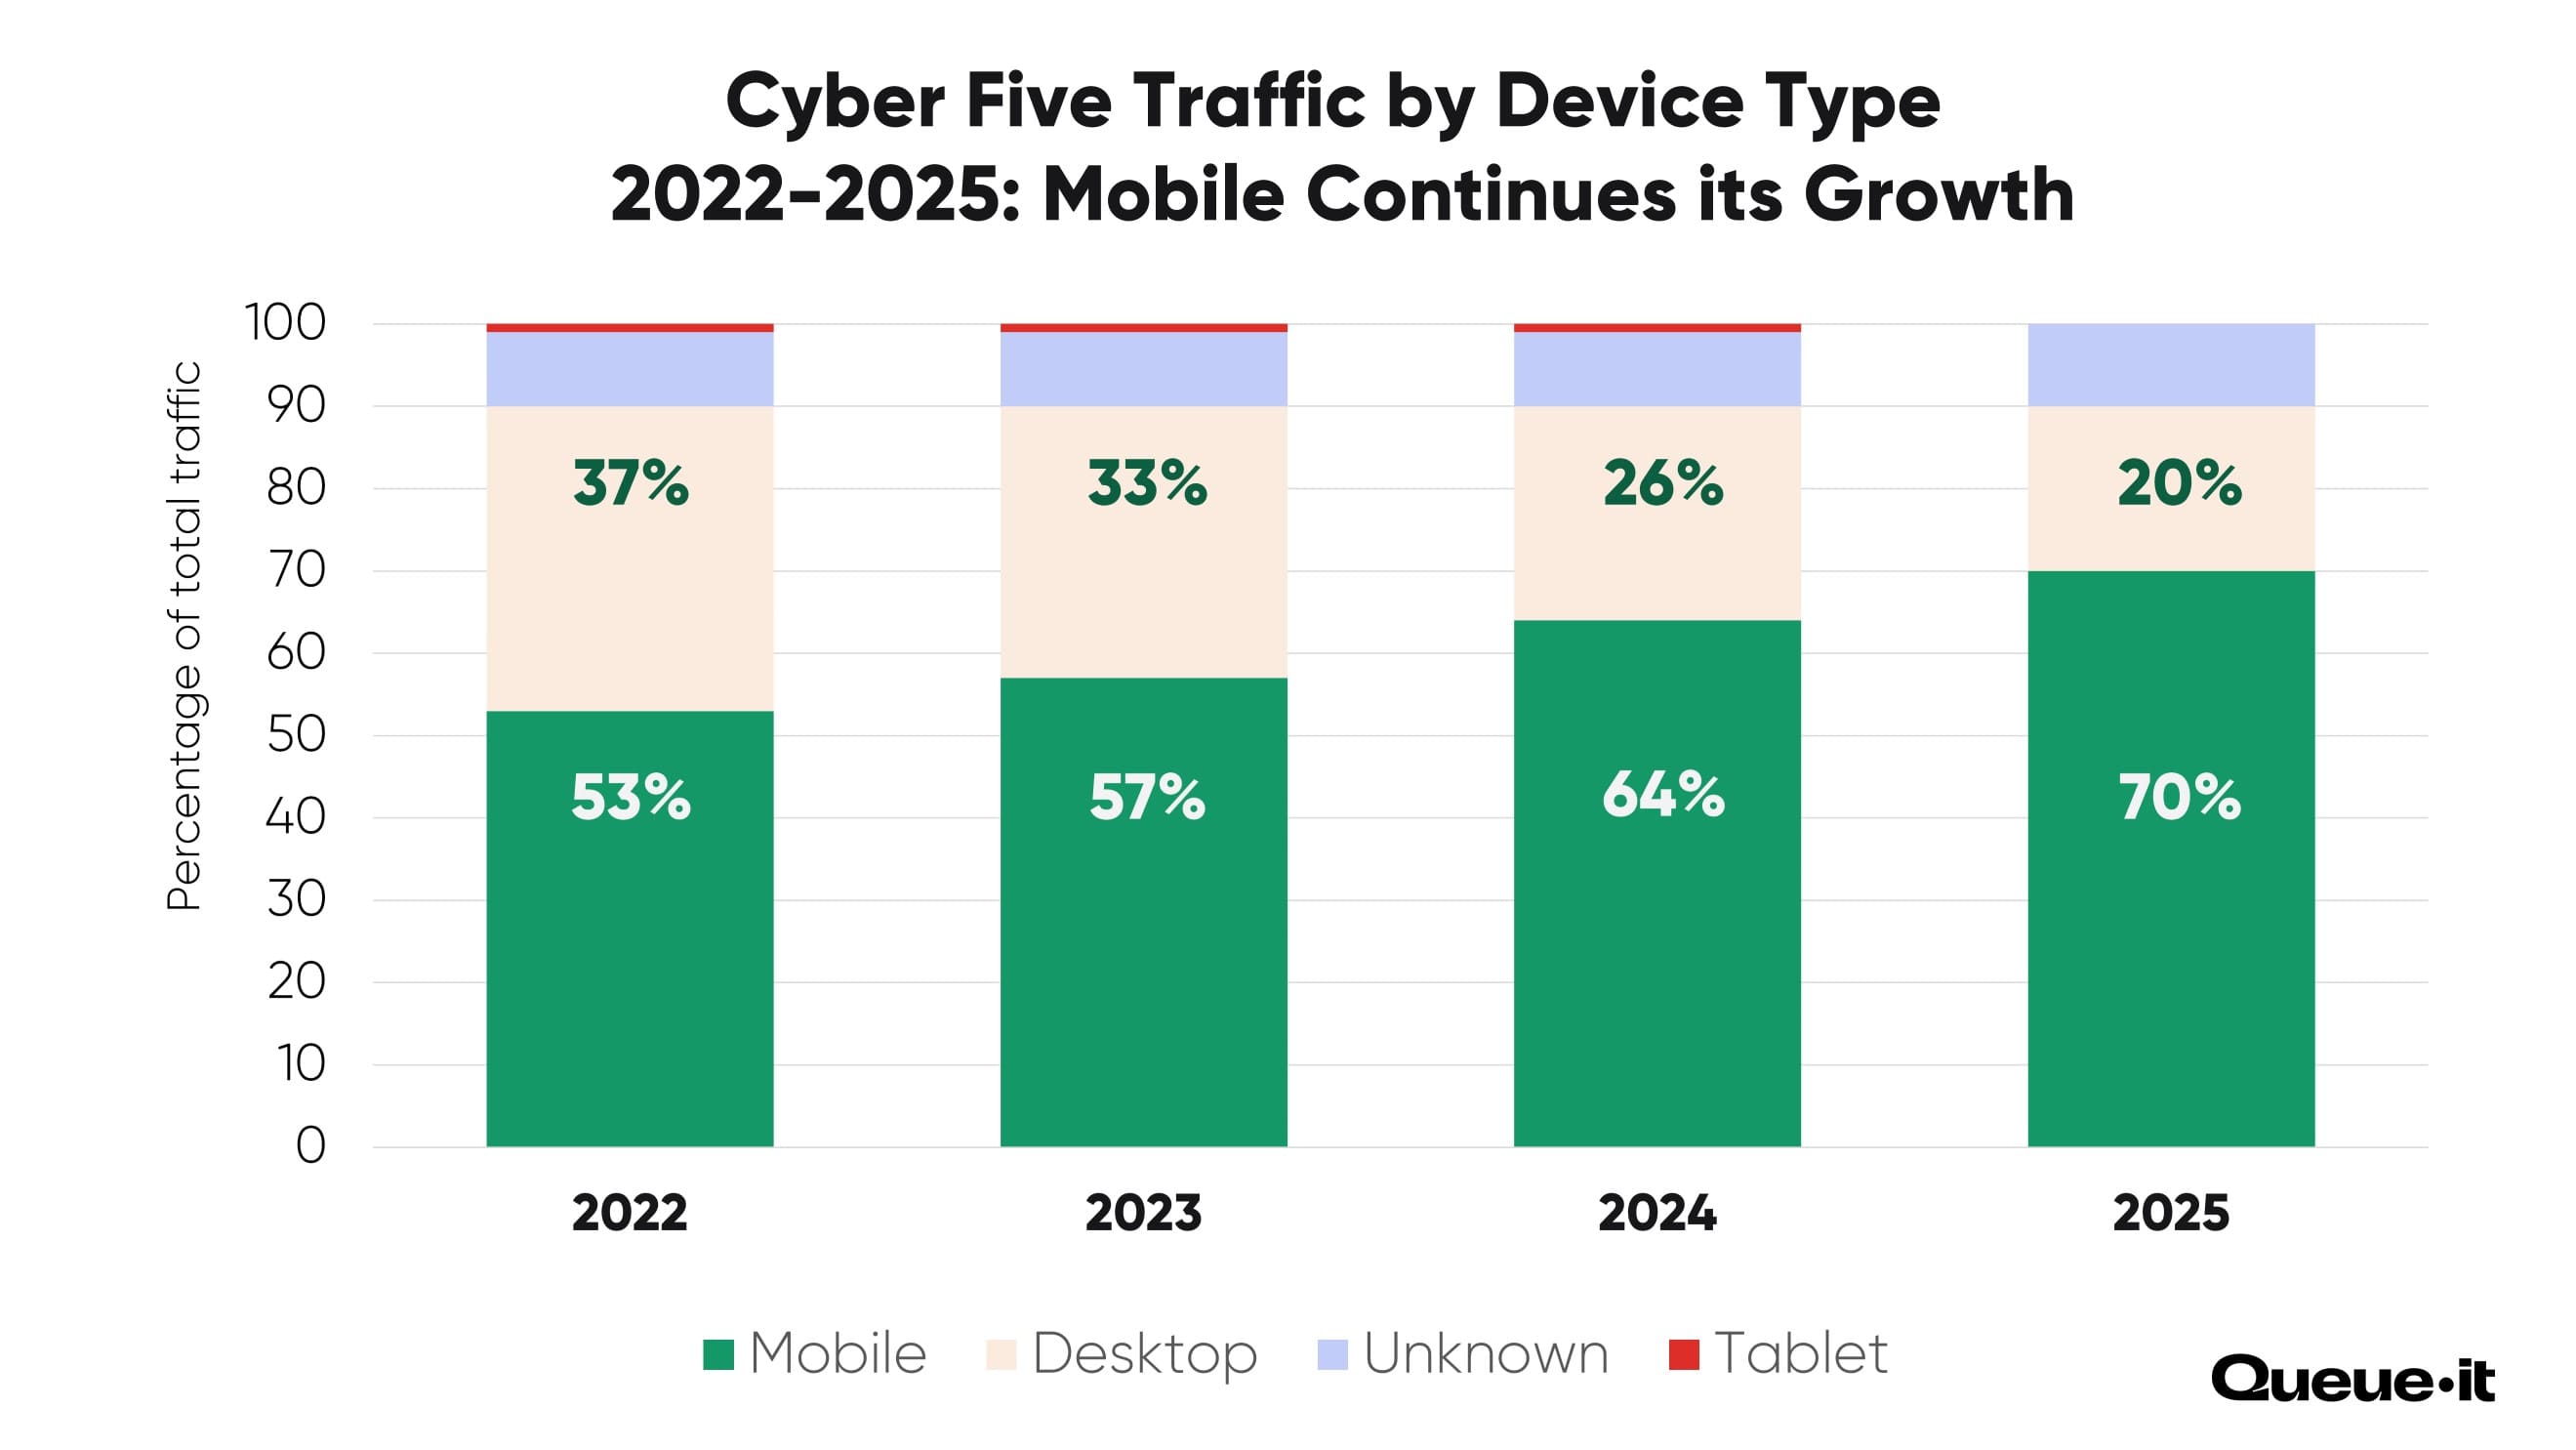
Cyber Five 2025 saw a slight increase in traffic from unknown devices, from 9% to 10%. These typically occur if the session comes from a data center, or the shopper is masking their device type with a VPN.
Of the Cyber Five days, Small Business Saturday saw the biggest share of mobile traffic, at 71.4%. Cyber Sunday had the fewest, with 68.8% of traffic coming from mobile devices.
The top countries with the highest share of mobile traffic across Cyber Five were:
- Saudi Arabia: 89% mobile traffic
- Belgium: 86% mobile traffic
- United States: 83% mobile traffic
The top categories with the highest share of mobile traffic across Cyber Five were:
- Health & Beauty: 85%
- Venues & Organizations: 85%
- Apparel & Accessories: 78%
Average web traffic by device for the full Holiday Season period (Nov. 1 to Dec. 19) was 61% mobile, 29% desktop, 9% unknown, and 1% tablet.
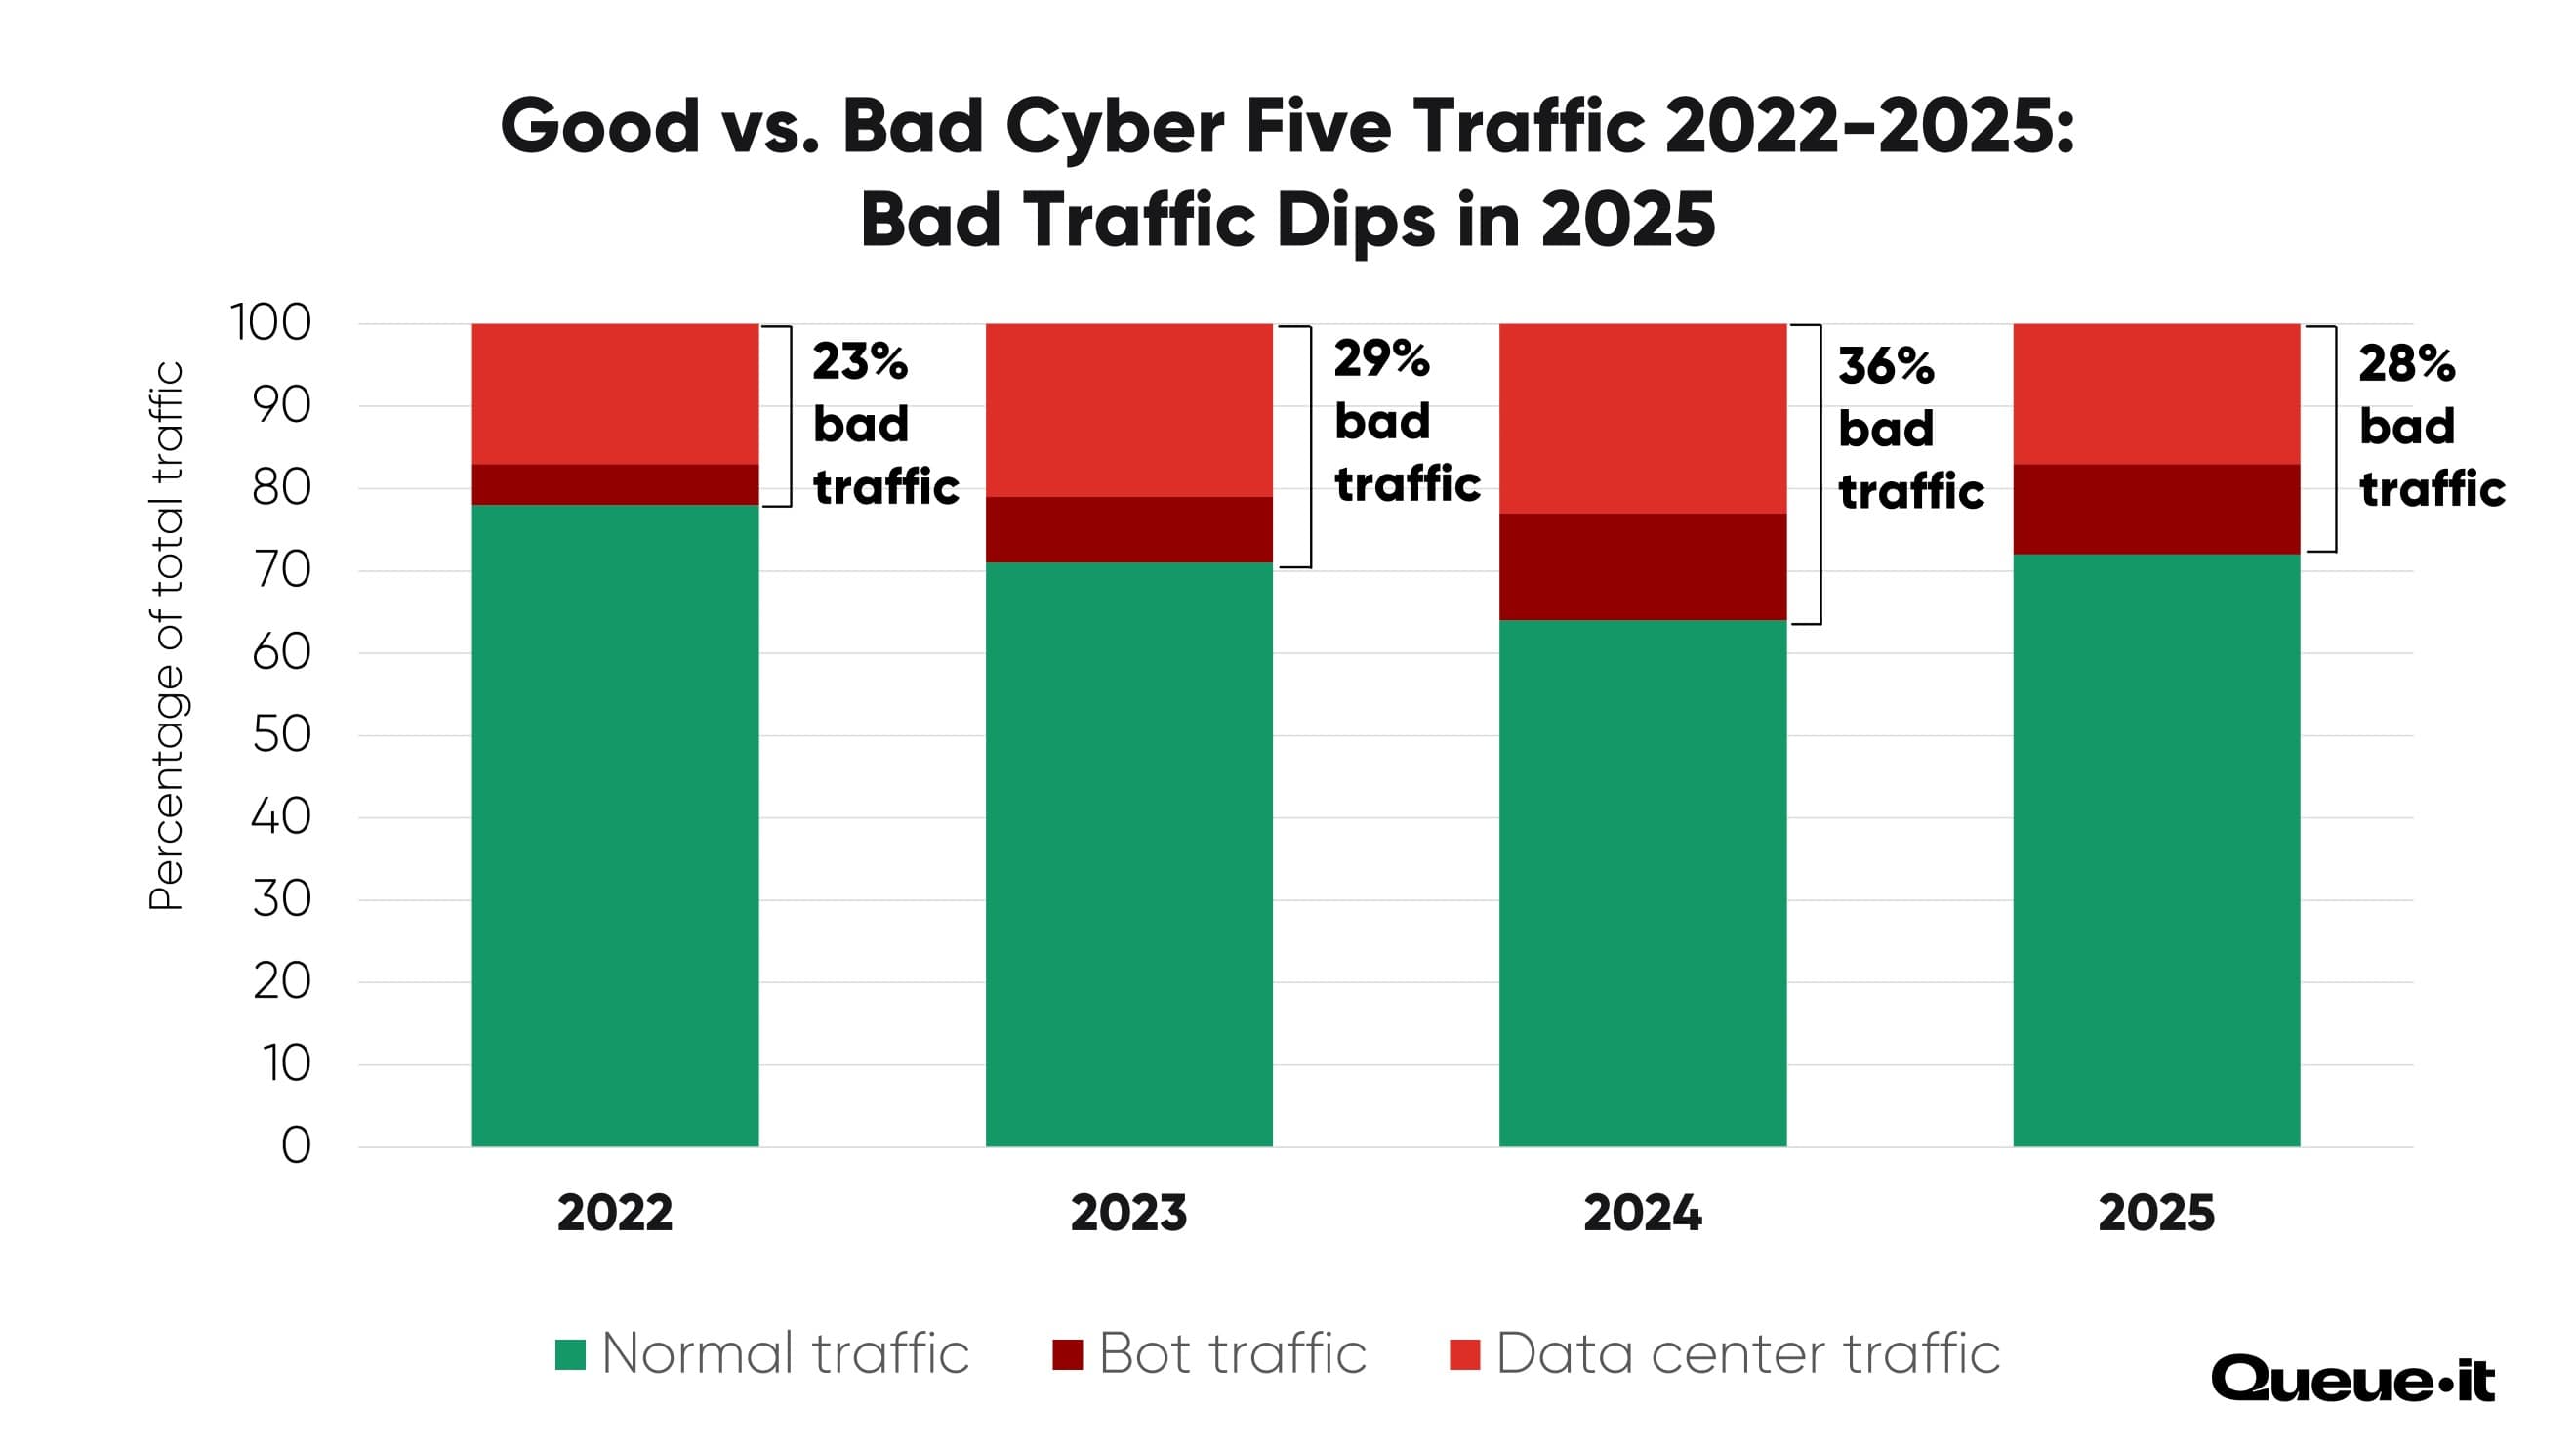
In 2025, 28% of all Cyber Five requests came from a bot or a data center, down from 36% in 2024.
This is the first time since Queue-it started reporting on bot and data center traffic that we've observed a year-over-year decline.
Data center traffic comes from massive buildings with racks of servers and computing infrastructure. Traffic from a data center rarely comes from a genuine visitor. Most likely it's a bad bot or malicious web scraper running on a rented server, or visitors trying to mask their identity by connecting with a VPN.
Unusual traffic requests (labeled below as “bot traffic”) come from visitors whose behavior or technology setup suggests to Queue-it they're not genuine.
This year, 17% of Cyber Five traffic came from data centers (down from 23% in 2024), and 11% came from bots (down from 13% in 2024). Note that a request can be flagged as both unusual and from a data center, so the range is as low as 17% and as high as 28%.
The countries targeted by the highest percentage of “bad traffic” during Cyber Five were:
- Norway: 81% bot & data center traffic
- Taiwan: 78% bot & data center traffic
- Australia: 56% bot & data center traffic
The categories targeted by the highest percentage of data center traffic during Cyber Five were:
- Department stores: 46% bot & data center traffic
- Electronics: 39% bot & data center traffic
- Hardware & Home Improvement: 37% bot & data center traffic
Bad traffic drives up retailers’ cloud computing costs, distorts conversion rates and other important analytics, and can even crash your site if it comes in too much volume.
Queue-it’s suite of bot mitigation tools help retailers identify and act on malicious traffic. With Traffic Insights, you get access to detailed, real-time traffic info detailing all suspicious and malicious activity (including data center and unusual requests). And with our bots and abuse packages, you can automatically block and challenge bad traffic, or configure detailed access rules, including visitor identification tokens, IP address blocking, and reputation scores.
RELATED: Bots & Abuse Protection: Serve Real Customers, Not Bad Bots
In 2025, 97% of suspicious visitors who were shown a bot challenge during Cyber Five failed to complete it, which equates to over eight million bot requests blocked via challenges.
When customers enable Queue-it’s Anomaly Detection or Traffic Access Rules, they can challenge or hard-block traffic according to the parameters they’ve set up. The challenges include a simple CAPTCHA test or a Proof-of-Work Challenge, which is invisible to human users but creates issues for bots.
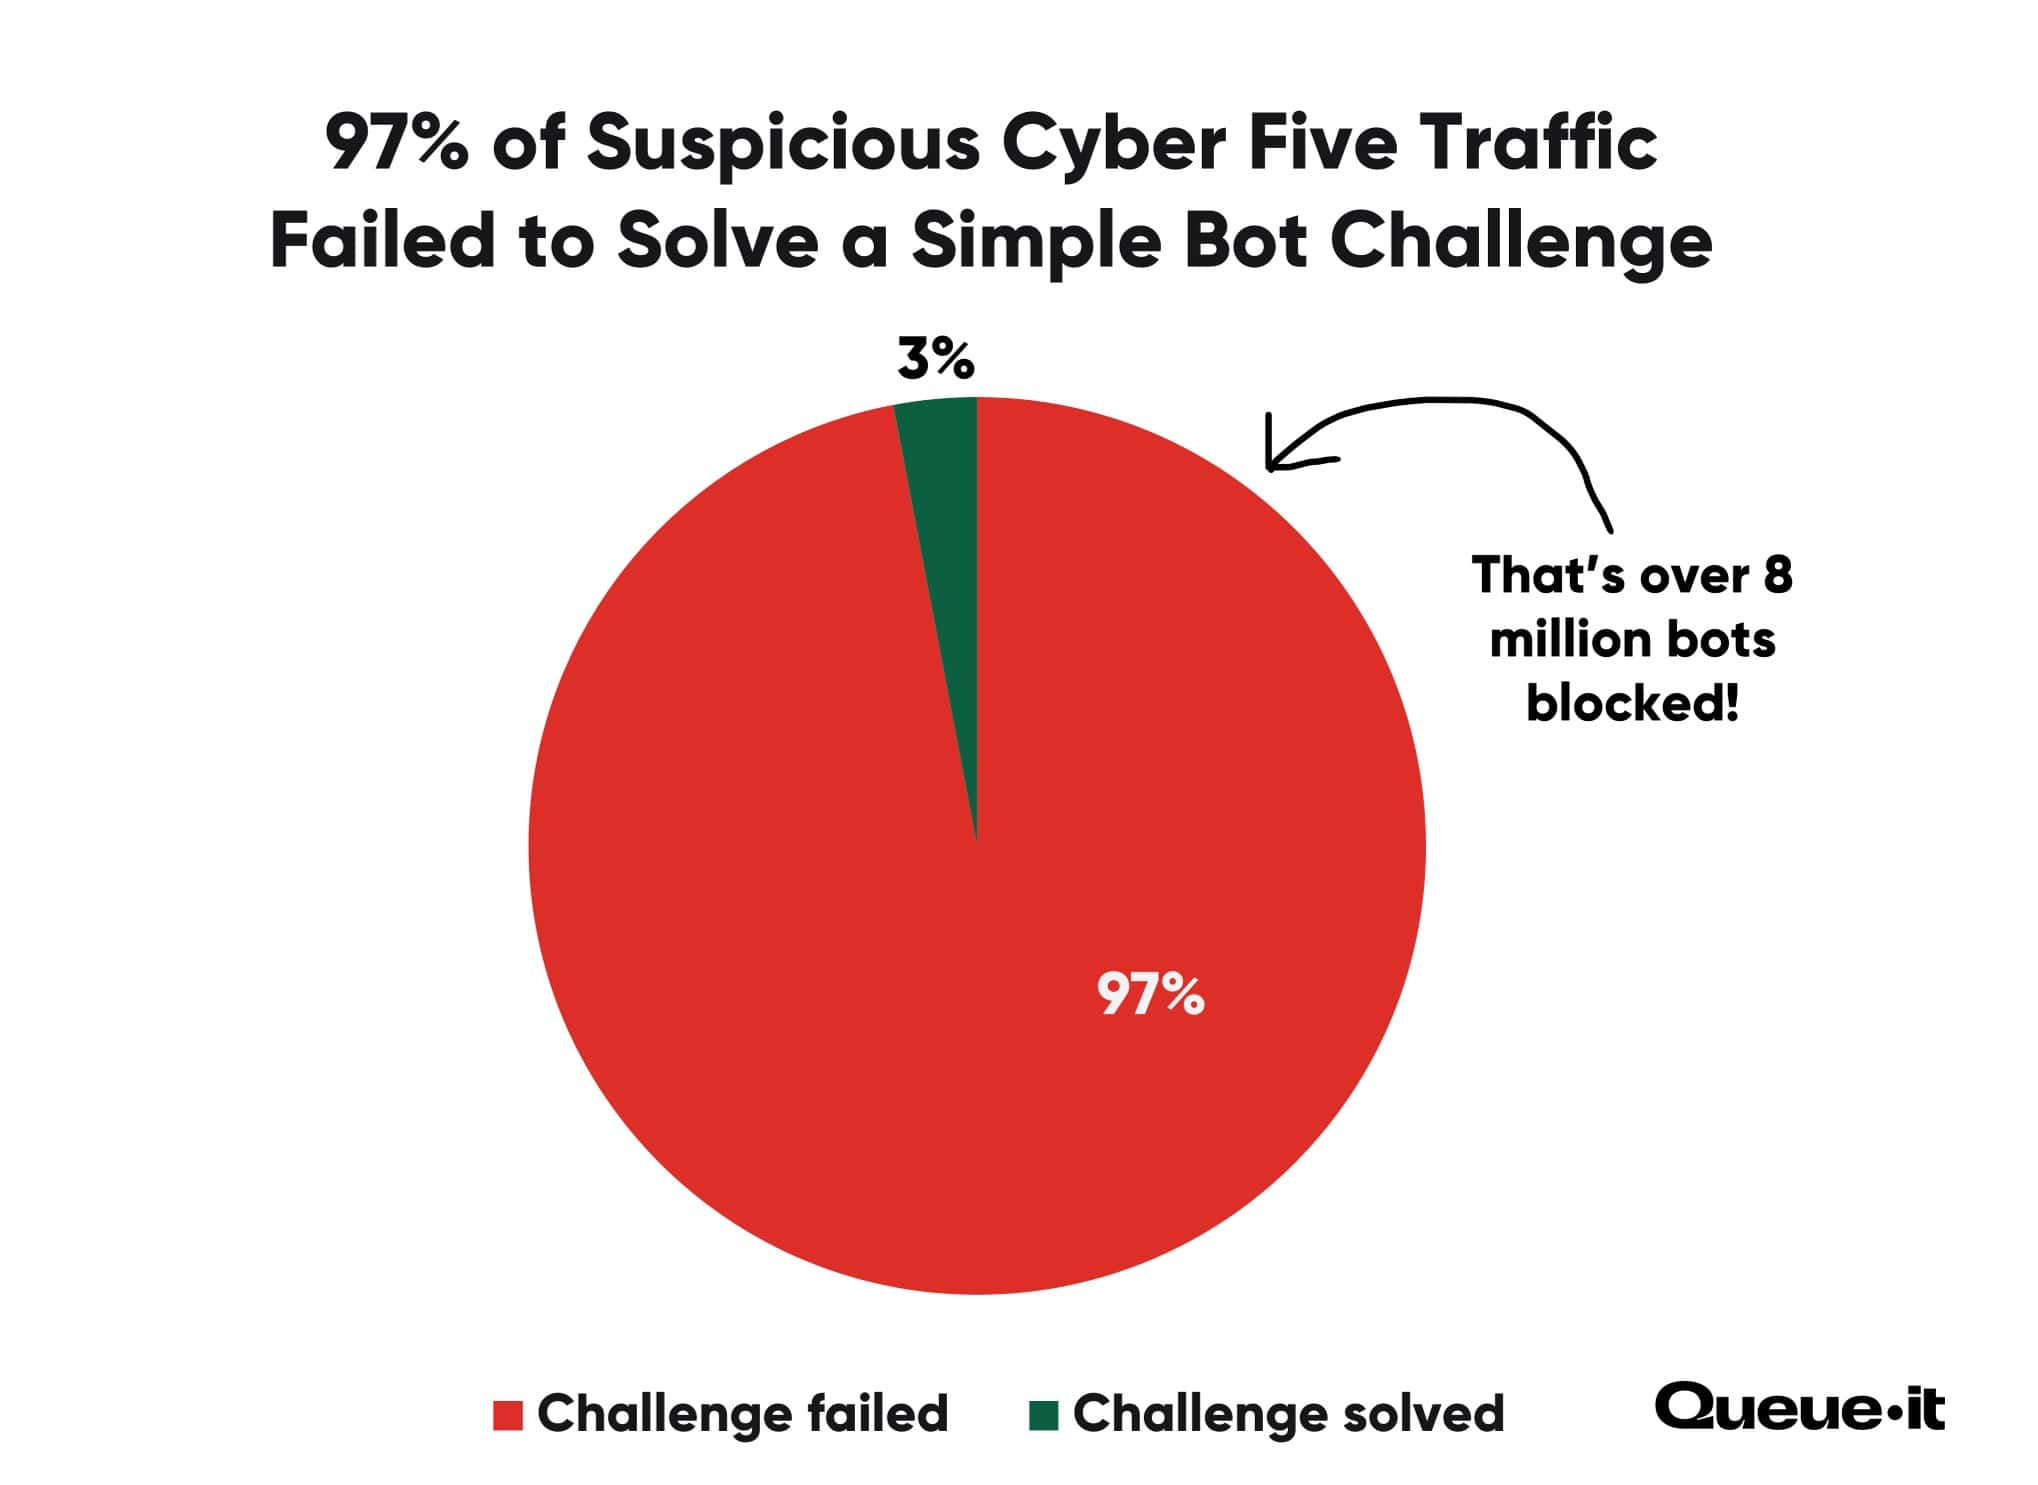
Across the full Holiday Season, retail customers using Queue-it’s Bots & Abuse challenges blocked over 43 million malicious requests, an increase of 65% year-over-year.
Despite growing bot sophistication, this data shows that simple challenges can still filter out a large portion of bot traffic. The fact that only 3% of visitors shown a bot challenge solved it also indicates that very few genuine human users were flagged as bots by Queue-it’s systems, showing that setting up challenges in this way presents minimal interruption to the typical user’s experience.
During the 2025 Holiday Season, 21 million ecommerce shoppers queued in a virtual waiting room, a 4% increase year over year.
Across the 138 retailers in our sample, 787 separate waiting rooms were deployed throughout the season, an average of six per retailer—used to protect different domains, apps, or critical points in the customer journey such as login or checkout. These waiting rooms were activated more than 2,000 times across the 49-day period, meaning the average retailer actively controlled site access 16 times during the Holiday Season.
While queued shoppers only accounted for around 1% of total web visits, virtual waiting rooms activate when demand exceeds what systems can safely handle. As a result, queued traffic serves as a clear signal of when demand spiked beyond planned capacity, rather than a measure of everyday shopping behavior.
These activations occurred almost exclusively during short, high-intensity traffic spikes around the season’s most competitive moments. By controlling access at these points, retailers protected all shoppers from slowdowns, errors, or outages that can otherwise take sites offline for extended periods, preserving both revenue and customer trust.
For most retailers in this report, queues operated in 24/7 Peak Protection mode, activating automatically only during unpredictable surges and deactivating once demand normalized. Despite sharp and irregular peaks, retailers maintained control throughout the season and never experienced traffic beyond what their systems could handle.
This approach also aligns with customer expectations, with 87% of shoppers saying they prefer a short wait for a website that works over immediate access to a slow or buggy experience, and 84% preferring an online queue with clear wait information to a crash or error page.
- Plan for peaks, not a longer season: Early holiday shopping has plateaued. But demand didn’t disappear, it compressed. Instead of spreading traffic evenly across November, shoppers concentrated their activity into fewer, higher-stakes days. For retailers, this makes peak moments riskier, not easier. Capacity planning, testing, and traffic management must now be built around worst-case days, not seasonal averages.
- Treat Cyber Five as a zero-tolerance window: Cyber Five delivered its strongest growth in years, with every day seeing double-digit year-over-year traffic increases. These are no longer forgiving days where minor slowdowns or incidents go unnoticed. Any performance issues, errors, or unfair access have an outsized impact on revenue and customer trust. Retailers should assume Cyber Five is when systems will be tested hardest and plan accordingly.
- Your mobile website & app are your flagship store: With 70% of Cyber Five traffic coming from mobile devices, mobile isn't just an important channel, it’s your flagship experience. Retailers should plan Holiday Season journeys assuming mobile-first behavior, from browsing and checkout to security and customer communication. Desktop performance still matters, but mobile experience now sets the tone.
- Assume bots will show up when it matters most: Bot and data center traffic declined year-over-year, but it still accounted for a significant share of peak-day traffic, and remains concentrated in high-value categories. This isn’t a background problem; it’s a peak-time threat. Retailers should plan for layered bot mitigation that protects infrastructure, preserves inventory for real shoppers, and keeps peak experiences fair.
This report is based on web traffic from a sample of 138 of Queue-it's online retail customers. The retailers are based in 31 countries across 6 continents. All traffic date stamps are based on UTC. Year-over-year comparisons are made with an identical set of 106 retailers who used Queue-it for Holiday Season sales in both 2024 and 2025. In-year comparisons are made with the full data set (138 retailers). Date range for full season data is Nov. 1 to Dec. 19.