91 powerful statistics that show why your ecommerce site speed matters in 2025

The statistics are sobering and underscore the importance of fast website speed in online retail. But the numbers also reveal a golden opportunity to get an edge on the competition.
When it comes to ecommerce speed, time really is money.
A slow site loses you sales, loyalty, and visibility. It wastes marketing spend and drives customers to competitors.
But few marketers see site speed as the priority it is. Most changes to ecommerce websites add fancy new animations and features that make pages slower, not faster.
That’s why we’ve scoured the web and found 91 powerful statistics that speak to the importance of ecommerce site speed. Get the concrete numbers you need to prove to your team just how crucial site speed is.
Table of contents
- Why is site speed important?
- Ecommerce site speed statistics
- How page speed boosts ecommerce revenue
- Ecommerce page load time benchmarks
- The importance of website speed for mobile
- Website load time statistics
- Page load time breakdown
- Marketers' perspectives on page load speed
- How high traffic can slow down your site
1. 40% of shoppers won’t wait more than 3 seconds before abandoning an ecommerce site.
2. 80% of users said a slow loading website is more frustrating than a temporarily down website.
3. Stress levels increase by 33% when content takes more than 6 seconds to load, the equivalent of a math test or watching a horror movie.
4. Almost 70% of consumers say page speed impacts their willingness to buy from an online retailer.
5. Half of online users surveyed say they’d prefer to miss out on animation and video if it meant getting faster load times.
6. Sites that appear on the first page of Google search results take an average 1.96 seconds to load. This means the better your speed, the better your Google ranking.
7. 83% of people expect websites to load in 3 seconds or less.
8. 73% of consumers would likely try an alternative site if the one they were on was too slow.
When an ecommerce page loads slowly:
9. Almost 50% of shoppers say they’ll try to refresh the page at least once.
10. 22% of shoppers say they’ll close the tab.
11. 14% say they’ll visit a competitor’s site.
12. 64% of online shoppers will shop elsewhere if they have a poor user experience.
13. 44% of online shoppers share negative online experiences with others.
14. 1 in 3 consumers say they’ll leave a brand they love after just one bad experience.
15. 65% of consumers trust a business less when they experience a problem.
RELATED: Boost Your Customer Experience with These 9 CX Tips & Tricks
16. A 1 second reduction in load time results in a conversion rate increase of 5.6%.
17. A site that loads in 1 second has a conversion rate 5x higher than one that loads in 10 seconds.
18. A 1 second reduction in load time decreases bounce rates by nearly 12%.
19. If an ecommerce site takes more than 4 seconds to load, 63% of shoppers will bounce.
20. If your ecommerce site takes 6 seconds to load, 2 out of 3 shoppers will leave.
21. Shoppers visit 8.9 pages when load time is 2 seconds, versus just 3.3 pages when load time is 8 seconds.
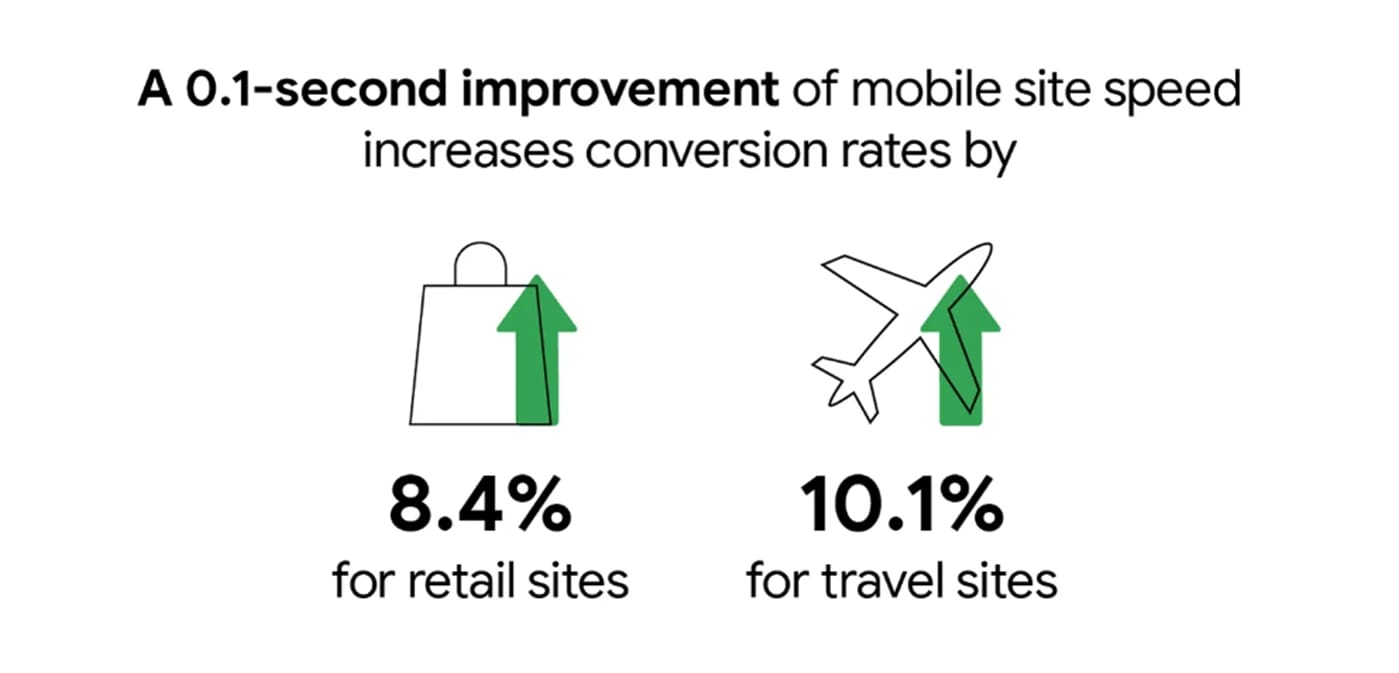
22. A 0.1 second improvement in mobile site speed increases retail conversions by 8.4%.
23. 9.1% more shoppers added items to their basket when mobile site speed increased by just 0.1 seconds.
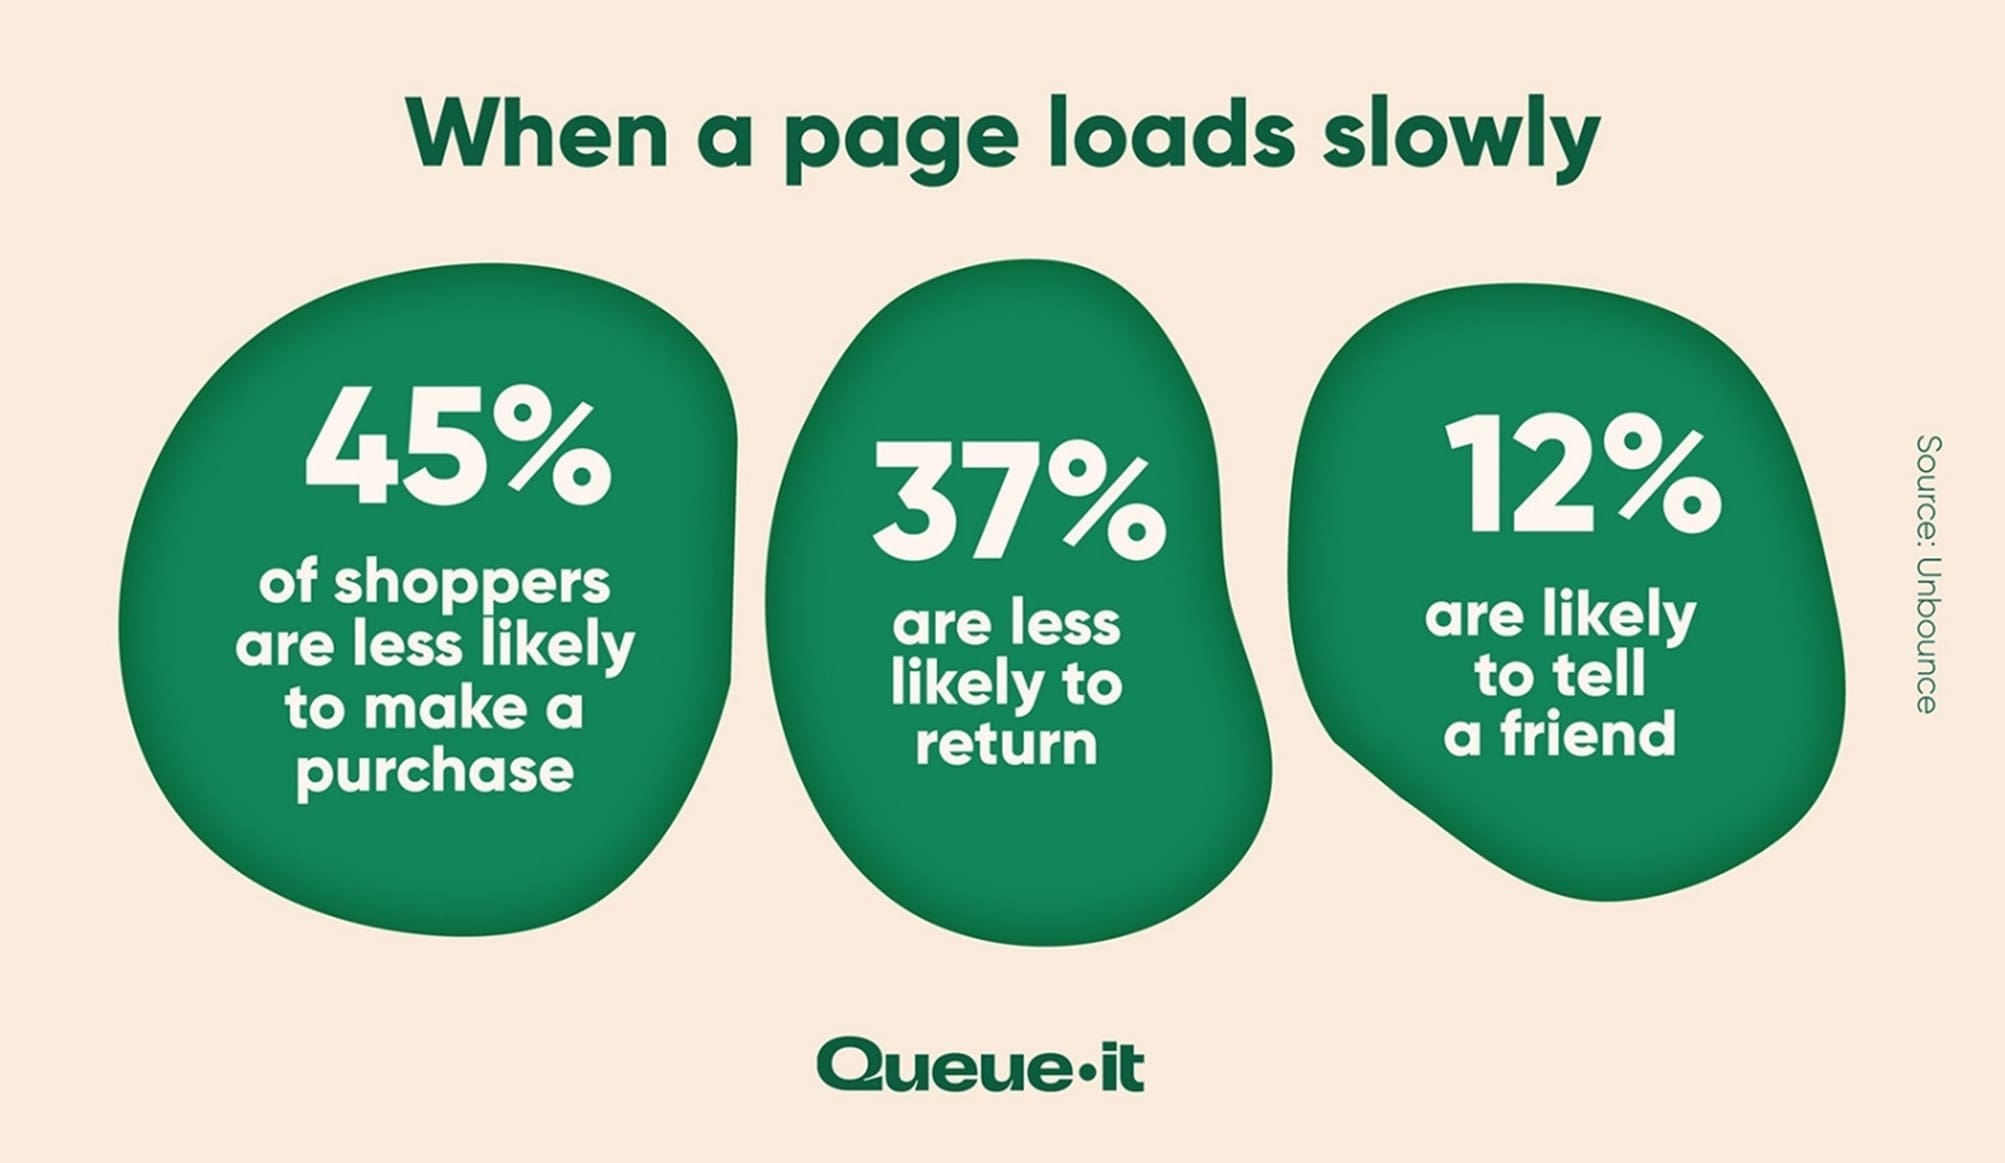
When a page loads slowly:
24. 45.4% of shoppers are less likely to make a purchase
25. 36.8% of shoppers are less likely to return.
26. 11.9% are likely to tell a friend.
RELATED: 79 Staggering Statistics That Show the Power of Loyalty Programs
Let’s say your ecommerce site has 50,000 daily visitors, a conversion rate of 3.5%, and an average order value of $50. Your average page loads in 6 seconds.
That would give you 1,750 orders per day and a daily revenue of $87,500.
Now, if we improve your average page speed by 1 second, your conversion rate jumps to 3.7%.
Suddenly your daily orders are 1,850 and your daily revenue is $92,500.
Fast forward one year, and that 1 second improvement has made you an extra $1.8 million.
Get your site down to Google’s recommended 3 second load time, and you’ll have an extra $5.5 million a year later.
And that’s just based on conversion rates. It doesn’t include the improvements to Google rankings, customer loyalty, and word-of-mouth marketing.
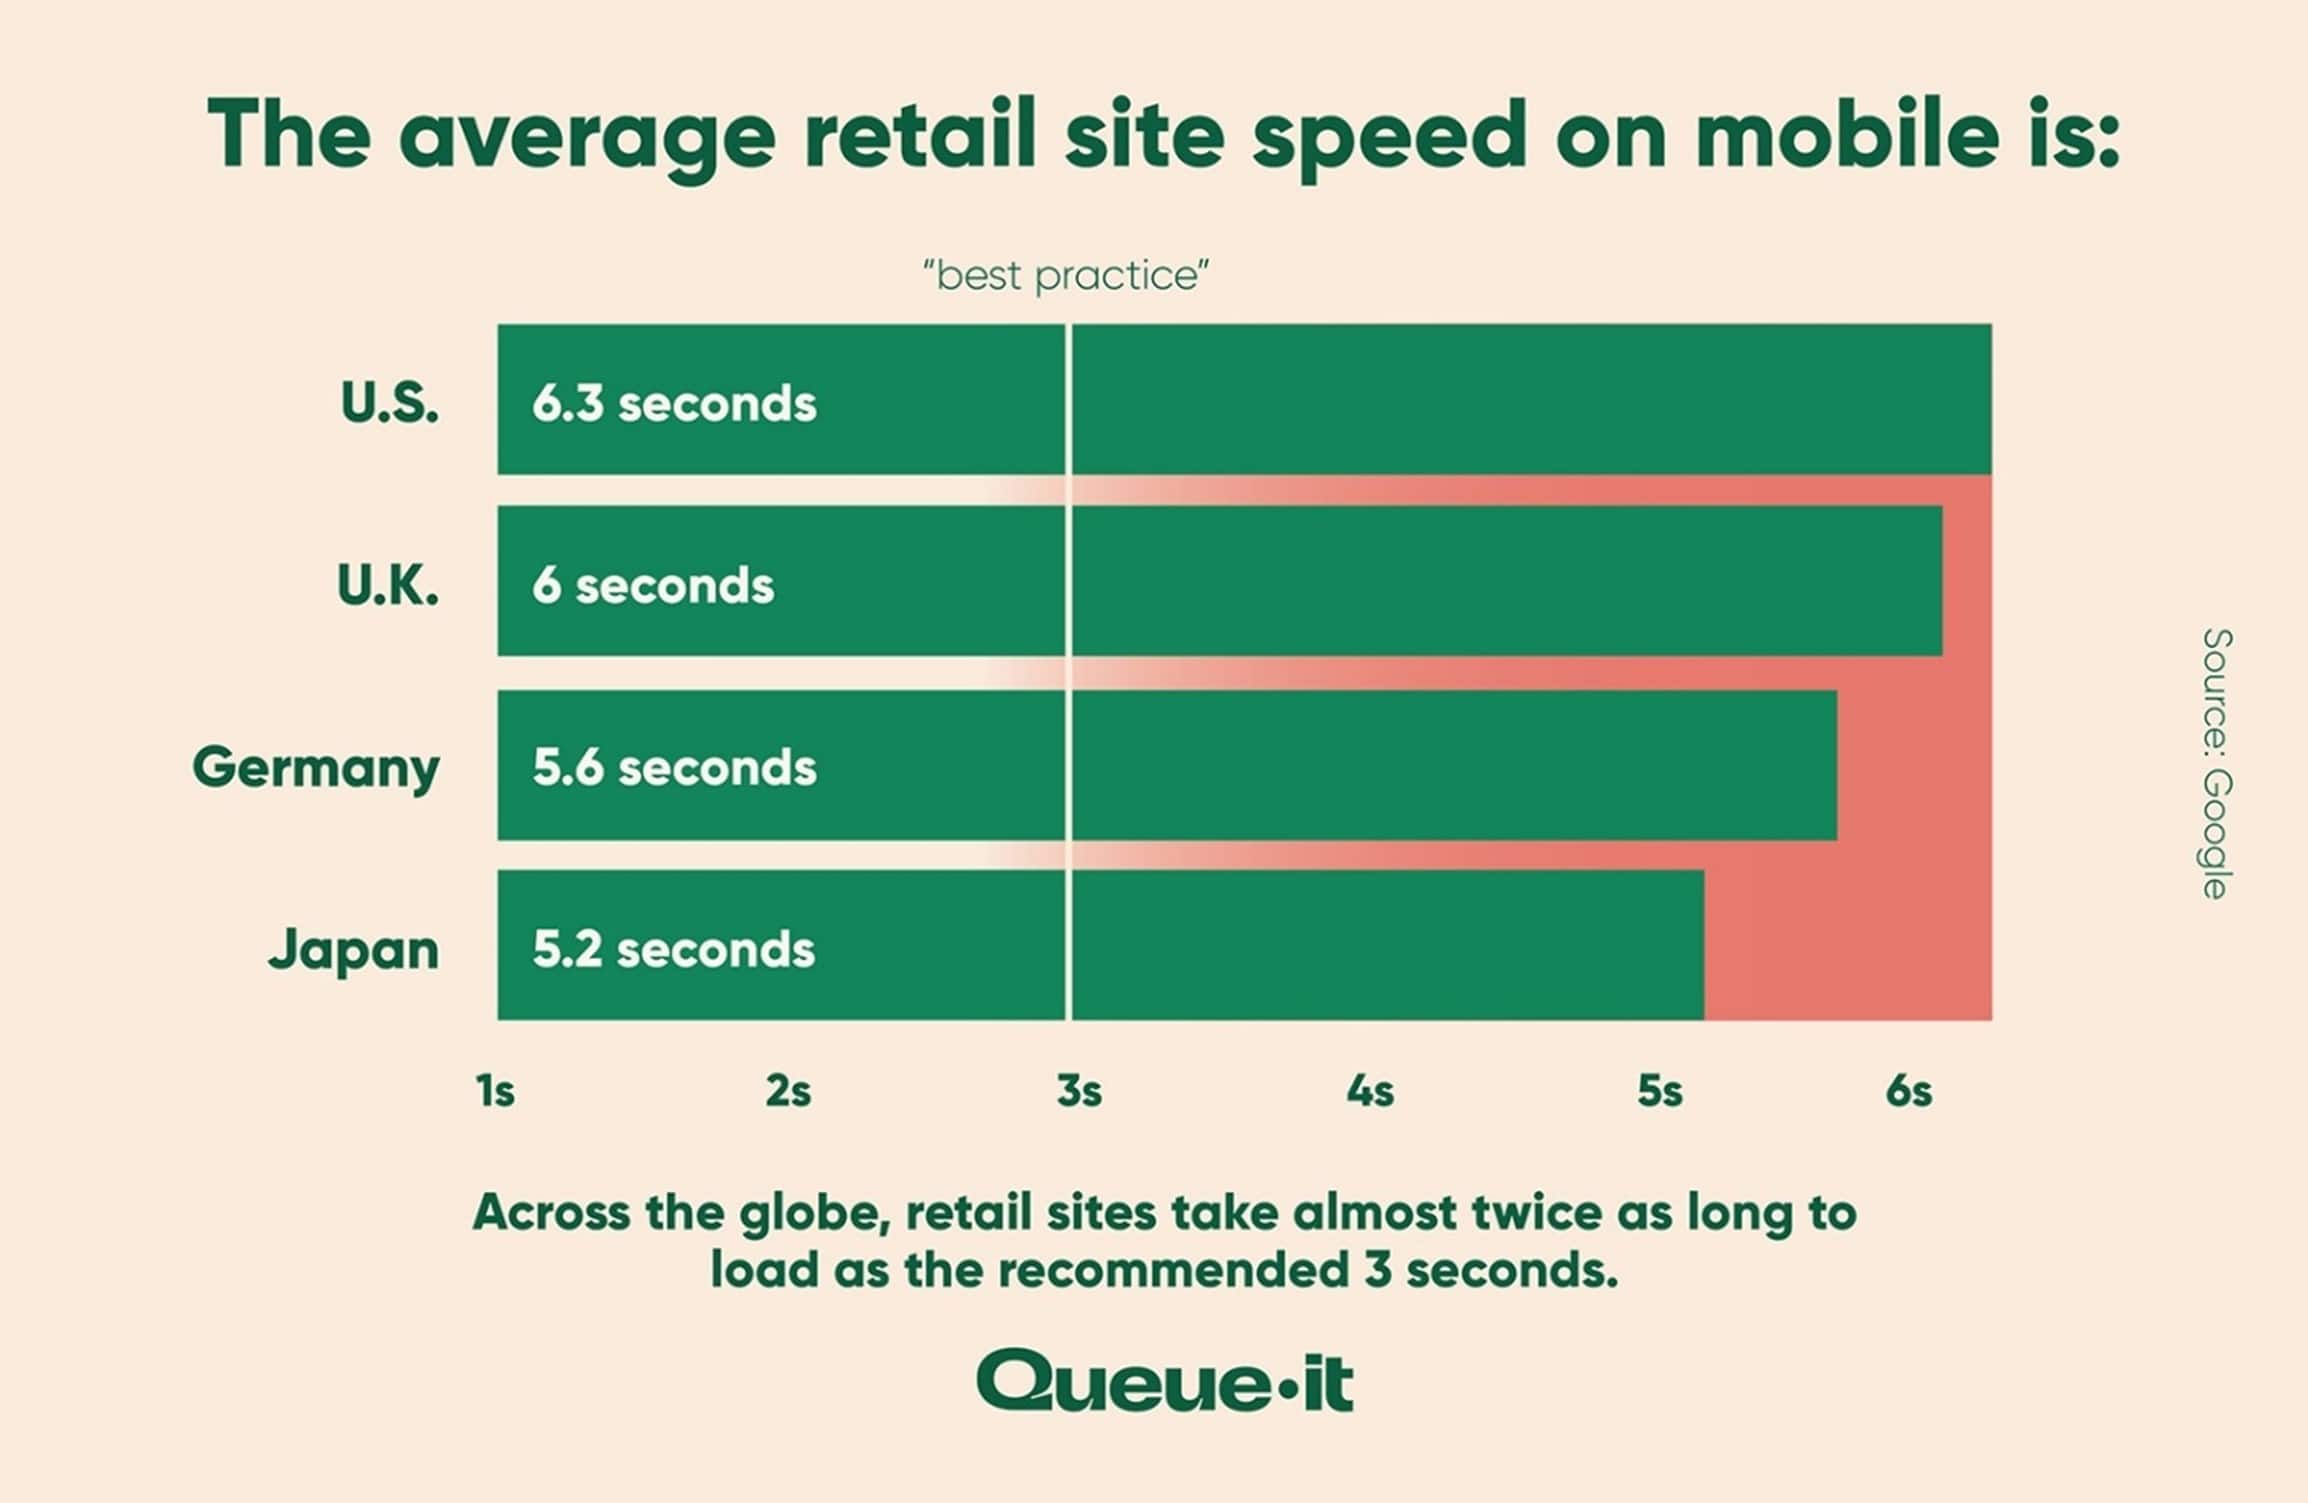
27. Google’s recommended mobile page load time is 3 seconds, but the faster the better.
28. U.S. retail sites take an average of 6.3 seconds to load on mobile, more than twice Google’s benchmark.
29. In the U.K., ecommerce sites take a slightly better 6 seconds to load.
30. 86% of ecommerce sites load in 5 seconds or less on desktop.
31. The average web page load time of the top 100 websites worldwide is 2.5 seconds on desktop.
32. On mobile, the top 100 sites take an average of 8.6 seconds to load.
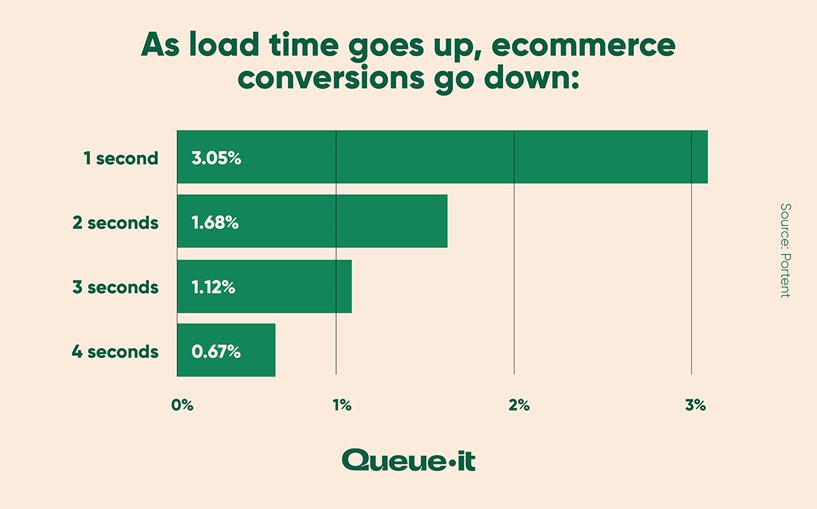
33. The highest ecommerce conversion rates (an average of 3.05%) occur on pages that load in 1 or 2 seconds.
34. The average unoptimized product detail page (PDP) takes 6.1 seconds to load.
35. Optimized PDPs load a full 2 seconds faster than unoptimized PDPs, taking 4.1 seconds to load.
36. PDPs and category pages make up 72% of all page views during the shopper journey.
37. Retail sites have the highest average pages per session out of any industry, with 5.01 pages per session on desktop.
38. This means optimized sites save buyers 23 seconds per shopper journey.
39. Traffic from mobile devices makes up 59% of all web traffic.
40. The average webpage takes 87.8% longer to load on mobile than on desktop.
41. Decreasing mobile page load speed by 1 second improves conversion rates by 5.9%.
42. That same 1 second improvement decreases bounce rate by nearly 9%.
43. 46% of people say waiting for pages to load is what they dislike most about browsing the web on mobile.
44. 85% of mobile users expect pages to load as fast or faster than they do on desktop—which almost never happens.
45. 64% of mobile users expect pages to load in under four seconds.
46. 53% of mobile visitors will leave a page if it takes more than 3 seconds to load.
47. 74% of mobile users say they’d abandon mobile sites that don’t load within 5 seconds.
48. Mobile users have an average bounce rate of 56.8%, compared to the average desktop bounce rate of 50%.
49. The average website takes around 15 seconds to load on mobile.
50. 95% of mobile users said they’d return to a fast site, compared to just 62% for a slow site.
51. 73% of mobile users have encountered websites they consider too slow.
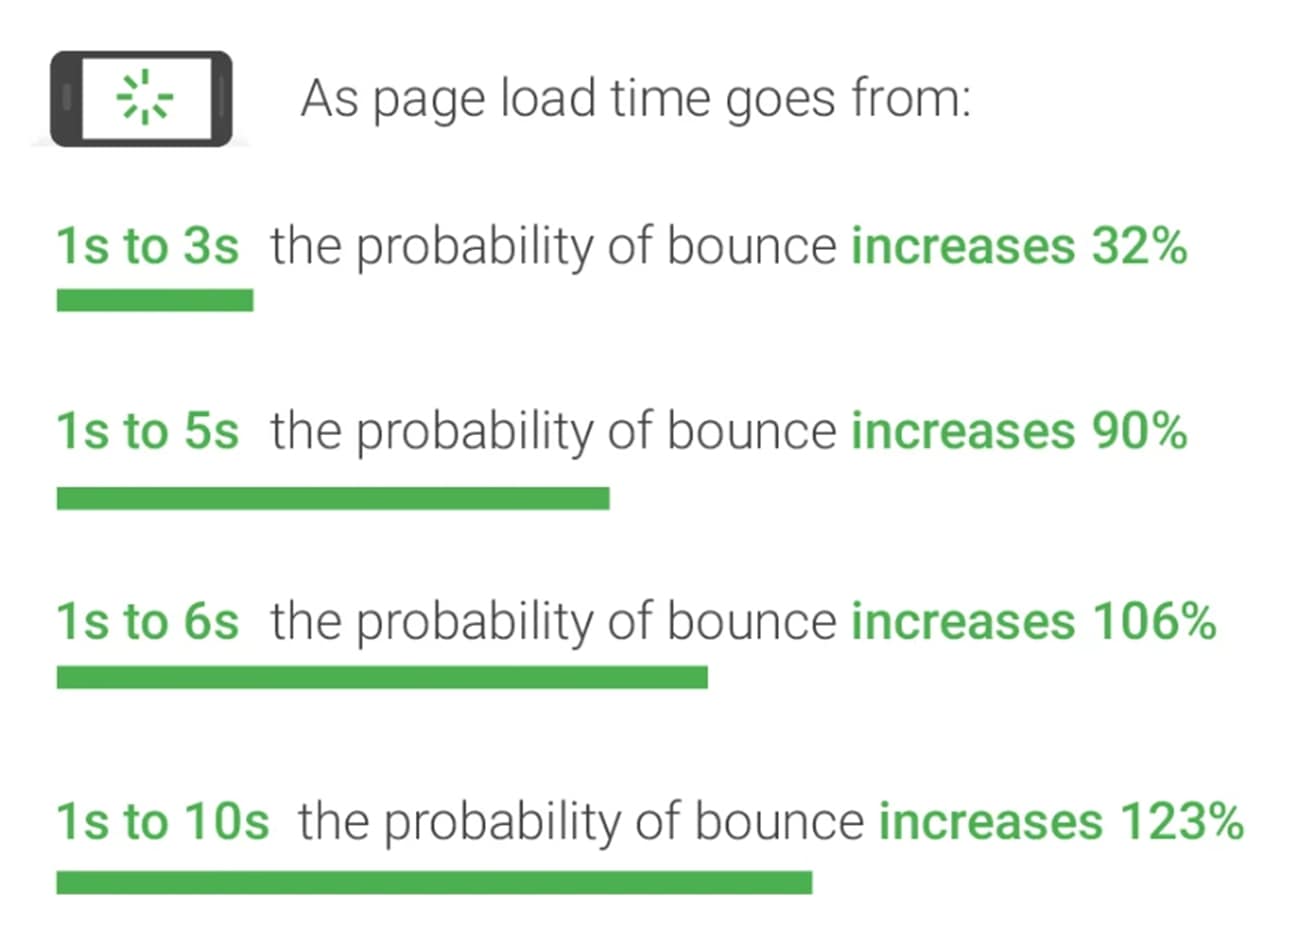
52. When page load times goes from 1 to 3 seconds, the chance of a bounce increases by 32%.
53. When it goes from 1 to 5 seconds, the chance of bouncing jumps 90%.
54. If a site jumps from 1 to 10 seconds to load, the chance of a bounce increases 123%.
55. Pages that load in under 2 seconds have an average bounce rate of 9%.
56. Pages that take 5 seconds to load have an average bounce rate of 38%.
57. When load time is 2 seconds, users visit an average of 8.9 pages.
58. When load time is 8 seconds, they visit just 3.3 pages.
59. Large pages take 318% longer to visually load compared to small pages.
60. Every third-party script on a site adds an average of 34.1 milliseconds to load time.
61. 25% of pages could save more than 250kb simply by compressing images and text.
62. 10% of pages could save more than 1mb by compressing images and text.
63. For every extra second of load time, the BBC loses 10% of its users.
64. When Yahoo! sped up its page load time by just 0.4 seconds, traffic increased by 9%.
These next stats break down some of the specific measures that make up page load speed. They get a bit into the weeds and technical terms, so we’ll pair the stats with some basic definitions.
Fully Loaded: The time it takes for a site to display as 100% loaded and usable.
65. The average time it takes fully load a webpage is 10.3 seconds on desktop.
66. On mobile, the average time is a massive 27.3 seconds.
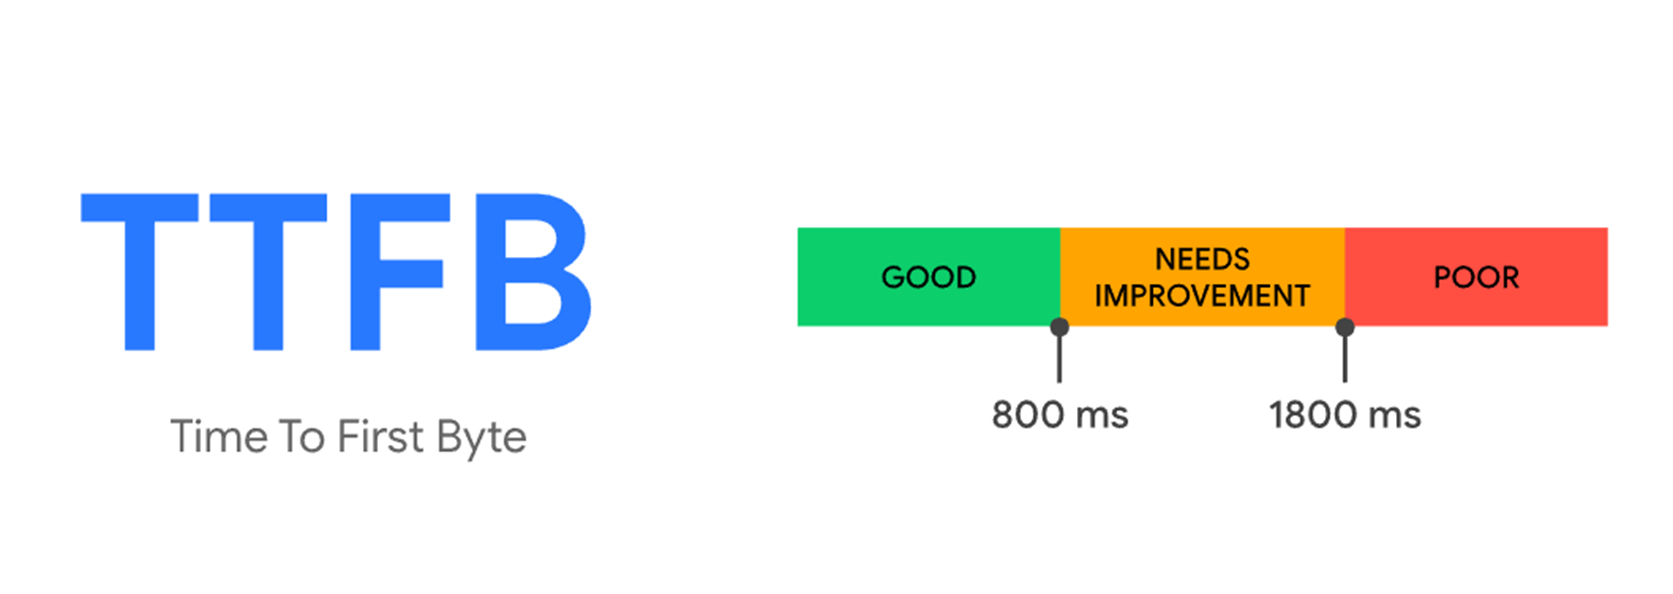
Time to First Byte (TTFB): The time it takes for the first byte of HTML to respond.
67. The average Time to First Byte (TTFB) speed is 1.286 seconds on desktop.
68. On mobile, TTFB averages 2.594 seconds.
69. Google recommends a TTFB speed of 800ms or less.
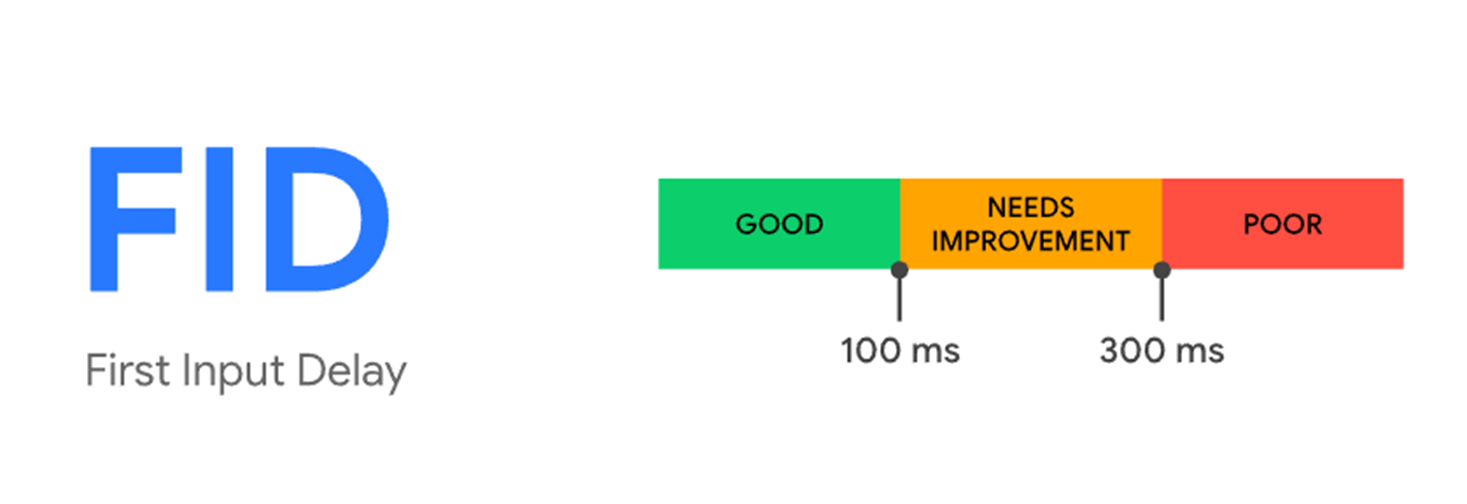
First Input Delay (FID): The time it takes from when a user first interacts with your site (when they click a link or hover over an interactive feature) to when the browser responds.
70. The average First Input Delay (FID) speed is 12.73 milliseconds on desktop.
71. On mobile, FID speed averages 59.73 milliseconds.
72. Google recommends an FID score of 100 milliseconds or less.
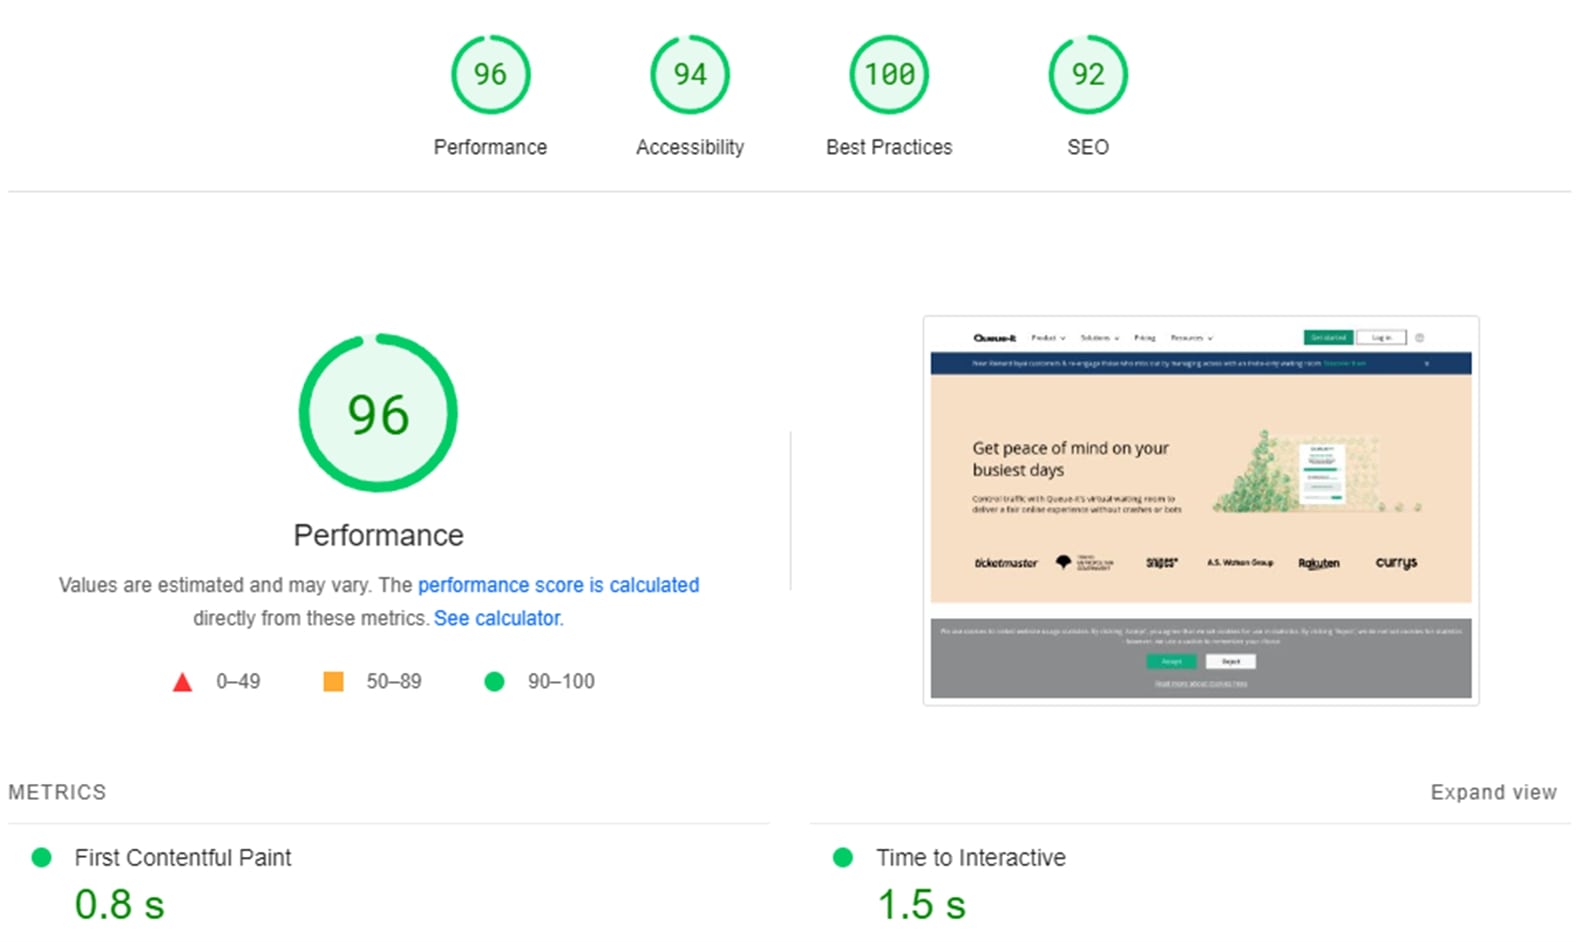
First Contentful Paint (FCP): The time it takes for a page to load enough for a user to be able to read the content on the page.
73. Google recommends your FCP should appear in 1.8 seconds or less.
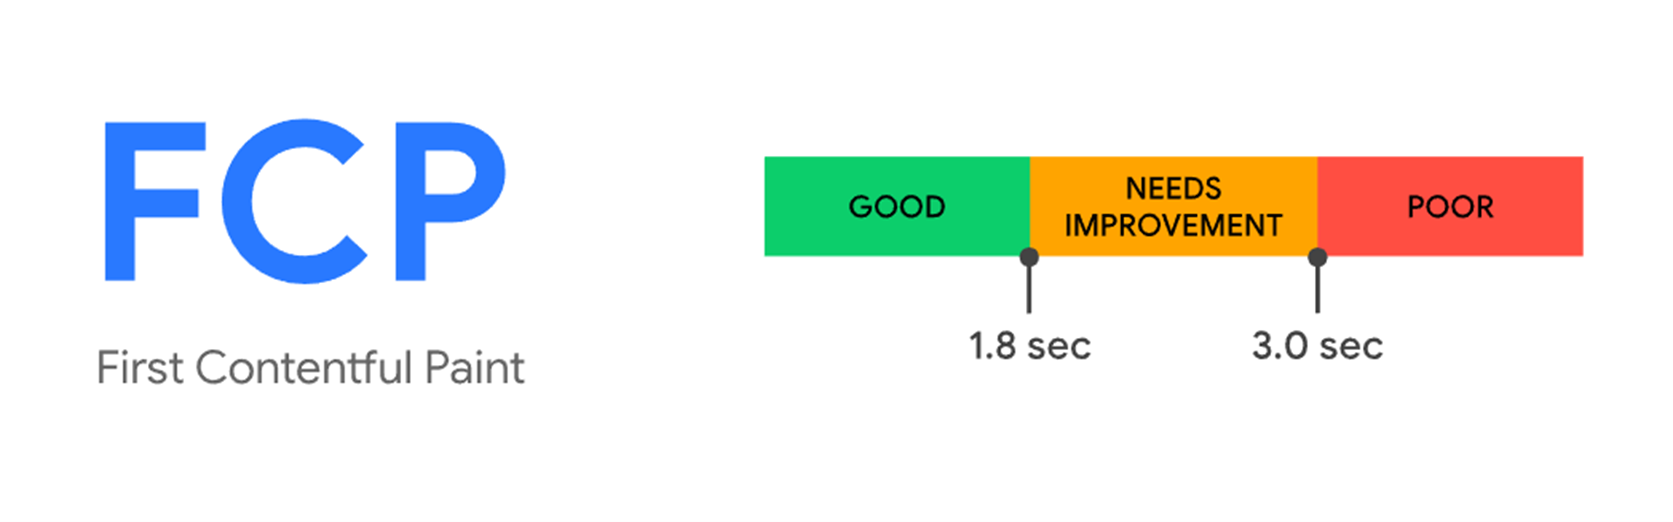
Optimizing the Queue-it home page got our FCP down to 0.8 seconds. You can check your own score on Google’s PageSpeed Insights tool.
74. 81% of marketers know speed impacts conversions, but don’t prioritize optimization.
75. Only 3% of marketers say faster load speed is their top priority.
76. But 73% of marketers think improving page speed is somewhat or very urgent.
How are marketers improving page speed?
77. 57% say they’ve optimized images, videos, or other media files.
78. 43% have implemented backend fixes like caching.
79. 39% have run speed tests.
80. 38% have reduced their dependence on JavaScript and CSS.
81. 22% implemented Accelerated Mobile Pages.
82. 14% began using a Content Delivery Network.
RELATED: Optimize Your Website Performance with These 11 Expert Tips
Everyone knows high traffic can crash your site. But few know that it can also cause slowdowns and errors.
The traffic-induced slowdown is sometimes called an IT brownout. A brownout typically results in slow load times or errors on dynamic areas of your site—such as when customers add items to cart, use site search, or log in.
During Black Friday, for instance, Pet Smart’s load speed almost doubled, jumping from 7.7 seconds to 13.84 seconds.
RELATED: How High Online Traffic Can Crash Your Site
Brownouts and traffic-induced slowdowns like these are more common than you’d think:
83. 50% of ecommerce consumers have experienced slowdowns during “high-traffic” occasions.
84. 82% of those who experienced slowdowns reported being unable to access their target website because of this.
85. 97% of enterprises experienced an IT brownout in the past three years.
86. The average number of brownouts for enterprises is 19 per year.
RELATED: The Cost of Downtime: IT Outages, Brownouts & Your Bottom Line
87. Costs are up to 16x higher for companies that have frequent outages and brownouts compared with companies who have fewer instances of downtime.
88. 53% of IT professionals think their company will experience a brownout or outage so severe that it makes national media headlines.
89. 53% think their company will experience a brownout or outage so severe that someone loses their job as a result.
90. 31% of IT professionals say they have experienced brand/reputation damage due to IT brownouts.
91. 30% said brownouts and outages lowered their stock price.
Hopefully these statistics show you (and your boss) that speed really does matter for your ecommerce business.
That said, there are still a ton of myths about web performance out there.
👇 Check that you’re not falling for one of these 3 common myths before your next big sale
(This blog has been updated since it was written in 2020)