
Discover the latest Black Friday statistics and trends you need to know to prepare for the West’s biggest shopping holiday. Uncover Black Friday sales volumes, consumer trends, retail marketing strategies, the hottest product categories, and more.
It’s the biggest shopping day of the year for retailers across the globe. People queue online and offline from the crack of dawn for doorbuster deals. Billions upon billions of dollars are spent—both by consumers and retail marketers. And it’s tough to find a single retailer who doesn’t take part.
It is, of course, Black Friday.
But what’s all the Black Friday fuss about? Just how much do consumers spend? What are retailers doing to ensure successful sales? And how is Black Friday—and the whole Holiday Season shopping period—changing?
The answers to these questions can be tough to find. So we’ve scoured the web for you and gathered 171 of the most impressive and surprising Black Friday statistics that show just how important Black Friday is for retailers.
Uncover the changes in consumer buying patterns, the marketing techniques driving the most sales, the technological developments that are defining Black Friday shopping, and the top categories customers shop on the day.
Want to jump straight into the Black Friday 2024 statistics, predictions, and consumer survey data? Click here for 2024 Black Friday stats.
Table of contents
- Black Friday sales volume
- Black Friday shopper statistics
- Black Friday consumer spending statistics
- Black Friday online traffic statistics
- Black Friday mobile shopping statistics
- Black Friday consumer trends
- Black Friday demographics
- Black Friday statistics Europe
- Black Friday retail trends
- Black Friday marketing trends
- Black Friday top product categories
- Black Friday 2024 statistics & predictions
- Definitions & sources
- Black Friday online sales grew 8% year-over-year (YoY) to $70.9 billion globally in 2023.
- Black Friday online sales in the U.S. increased by 9% YoY, reaching $16.4 billion (per Salesforce).
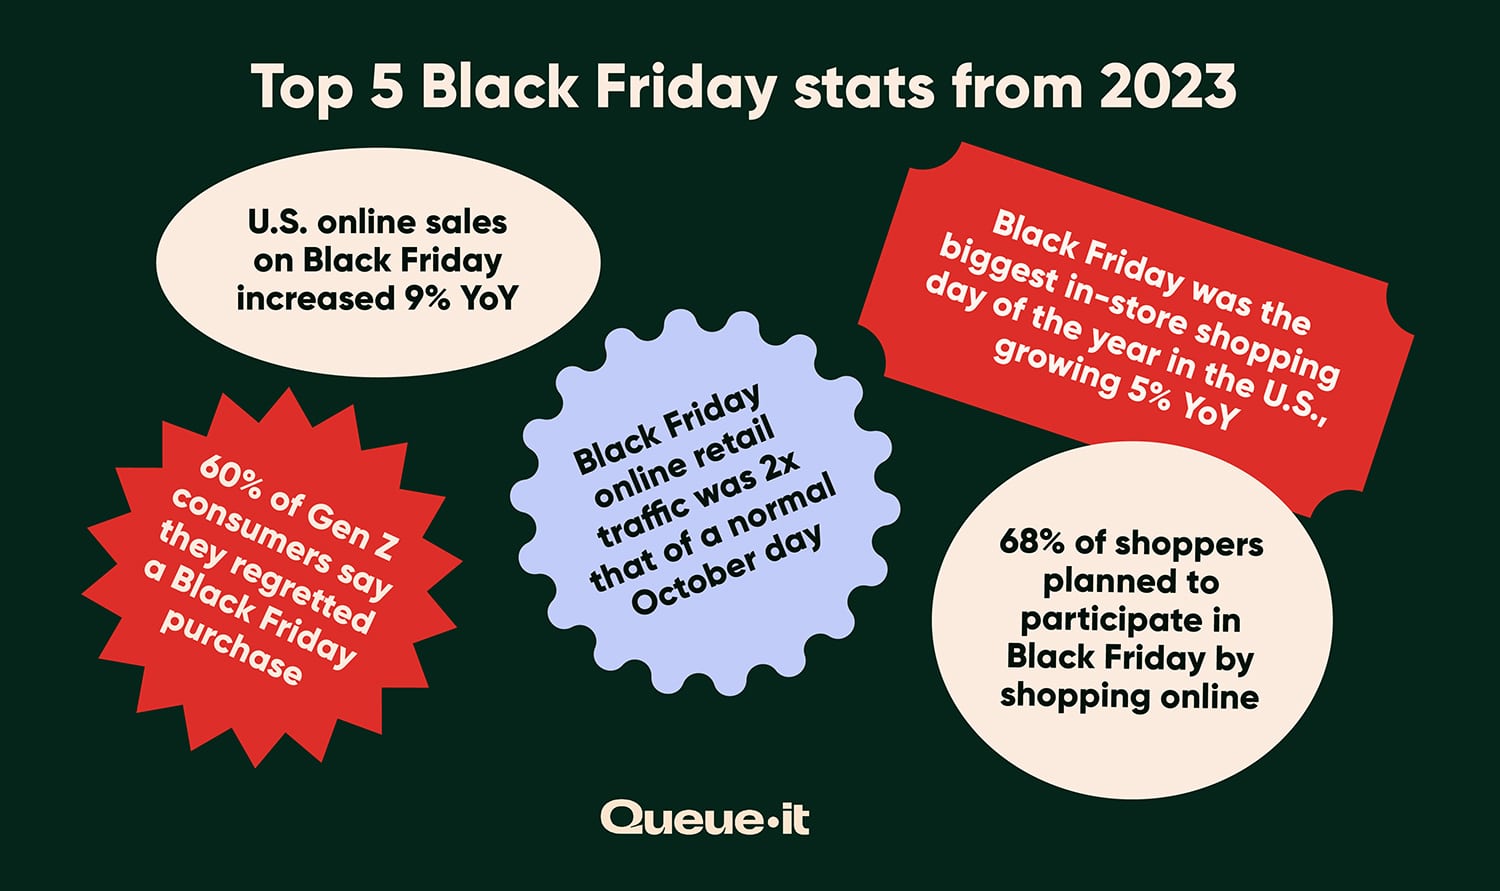
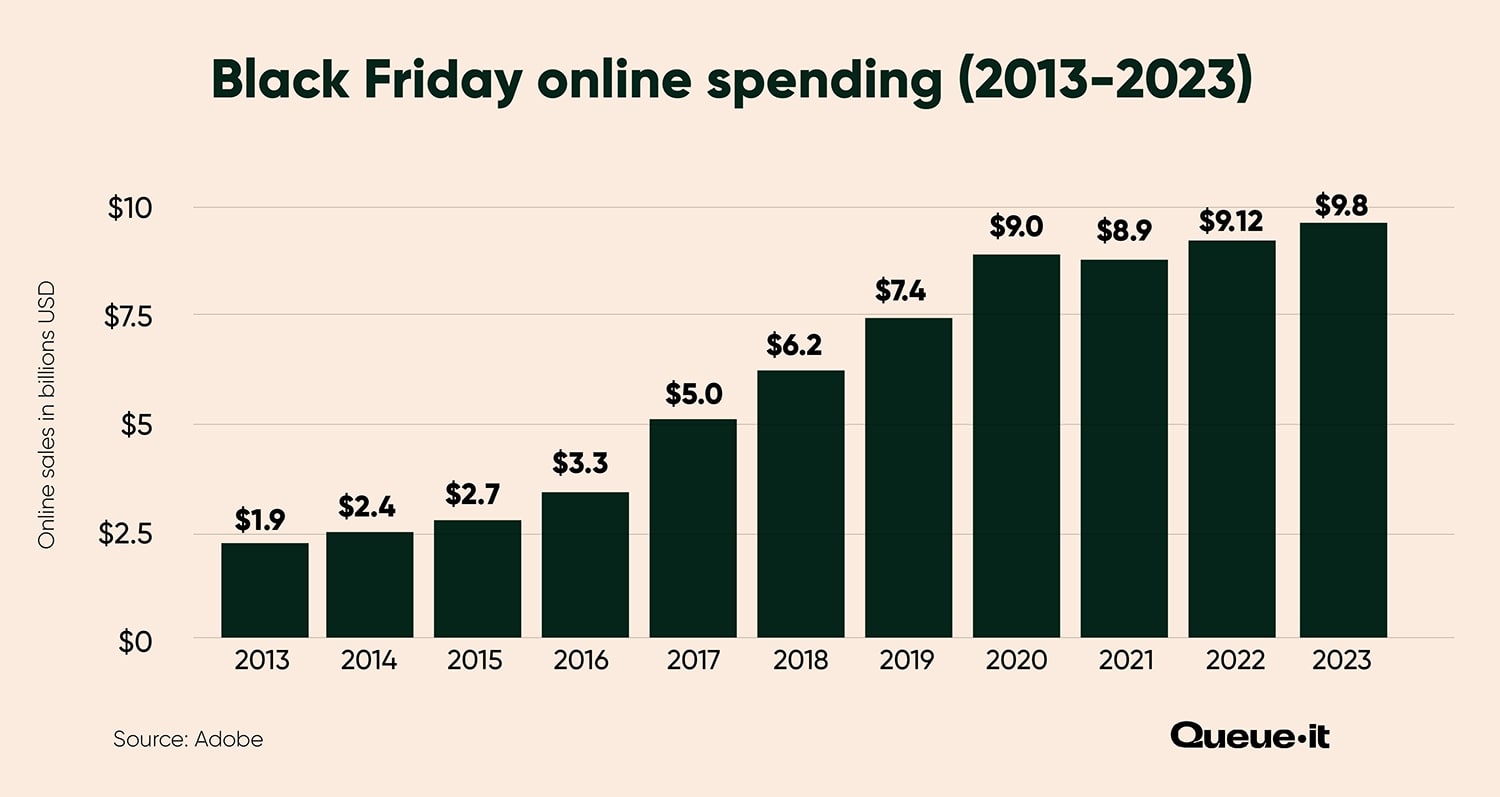
- Black Friday drove $9.8 billion in U.S. online sales, up 7.5% YoY (per Adobe).
- Total U.S. retail sales on Black Friday increased 5% YoY.
- In-store Black Friday shopping increased by 1.1%, a much smaller margin than the 8.5% increase for ecommerce (per Mastercard).
- Cyber Week global sales increased 6% YoY, hitting $298 billion in 2023.
Total U.S. retail sales on Black Friday increased 5% YoY.
- Cyber Week U.S. sales increased by 5% YoY, hitting $70.8 billion.
- Online retail sales across the full Holiday Season increased 6.3% YoY while in-store sales were up 2.2%.
- Adobe reported a 4.9% increase in U.S. online sales across the full Holiday Season, hitting a record $222.1 billion dollars.
- A total of $123.5 billion was spent online in the month of November alone (up 6% YoY).
- Cyber Week drove $38 billion in online U.S. spending (up 7.8% YoY).
- U.S. retail sales during the 2023 Holiday Season grew 3.8% YoY to a record $964.4 billion.
- Black Friday was 2023’s most popular day for in-store shopping in the U.S., with 76.2 million shoppers visiting brick-and-mortar locations, up 4.5% from 72.9 million in 2022.
- Black Friday was also the most popular day for online shopping, with 90.6 million U.S. consumers shopping, up 3.9% from 87.2 million in 2022.
- 59 million consumers shopped in stores on the Saturday after Thanksgiving, down almost 7% from 63.4 million last year.
- A record 200.4 million consumers shopped during Cyber Week 2023, surpassing last year’s record of 196.7 million by 1.9%.
- 121.4 million people visited physical retail locations in 2023, a 1% drop from 122.7 million in 2022.
- Online shoppers totaled 134.2 million, up 3% from 130.2 million last year.
- Holiday shopping participation reached pre-pandemic levels at 95% (versus 92% in 2022).
- 68% of shoppers planned to participate in Black Friday by shopping online in 2023.
- Less than a third of U.S. consumers planned to shop in-store on Black Friday 2023.
Less than a third of U.S. consumers planned to shop in-store on Black Friday.
- 31% of surveyed respondents in the U.S. planned to do their holiday shopping on both Black Friday and Cyber Monday.
- More than half of U.S. holiday shoppers who visited a store said they looked up product reviews online and-or located an item in-store by checking it online.
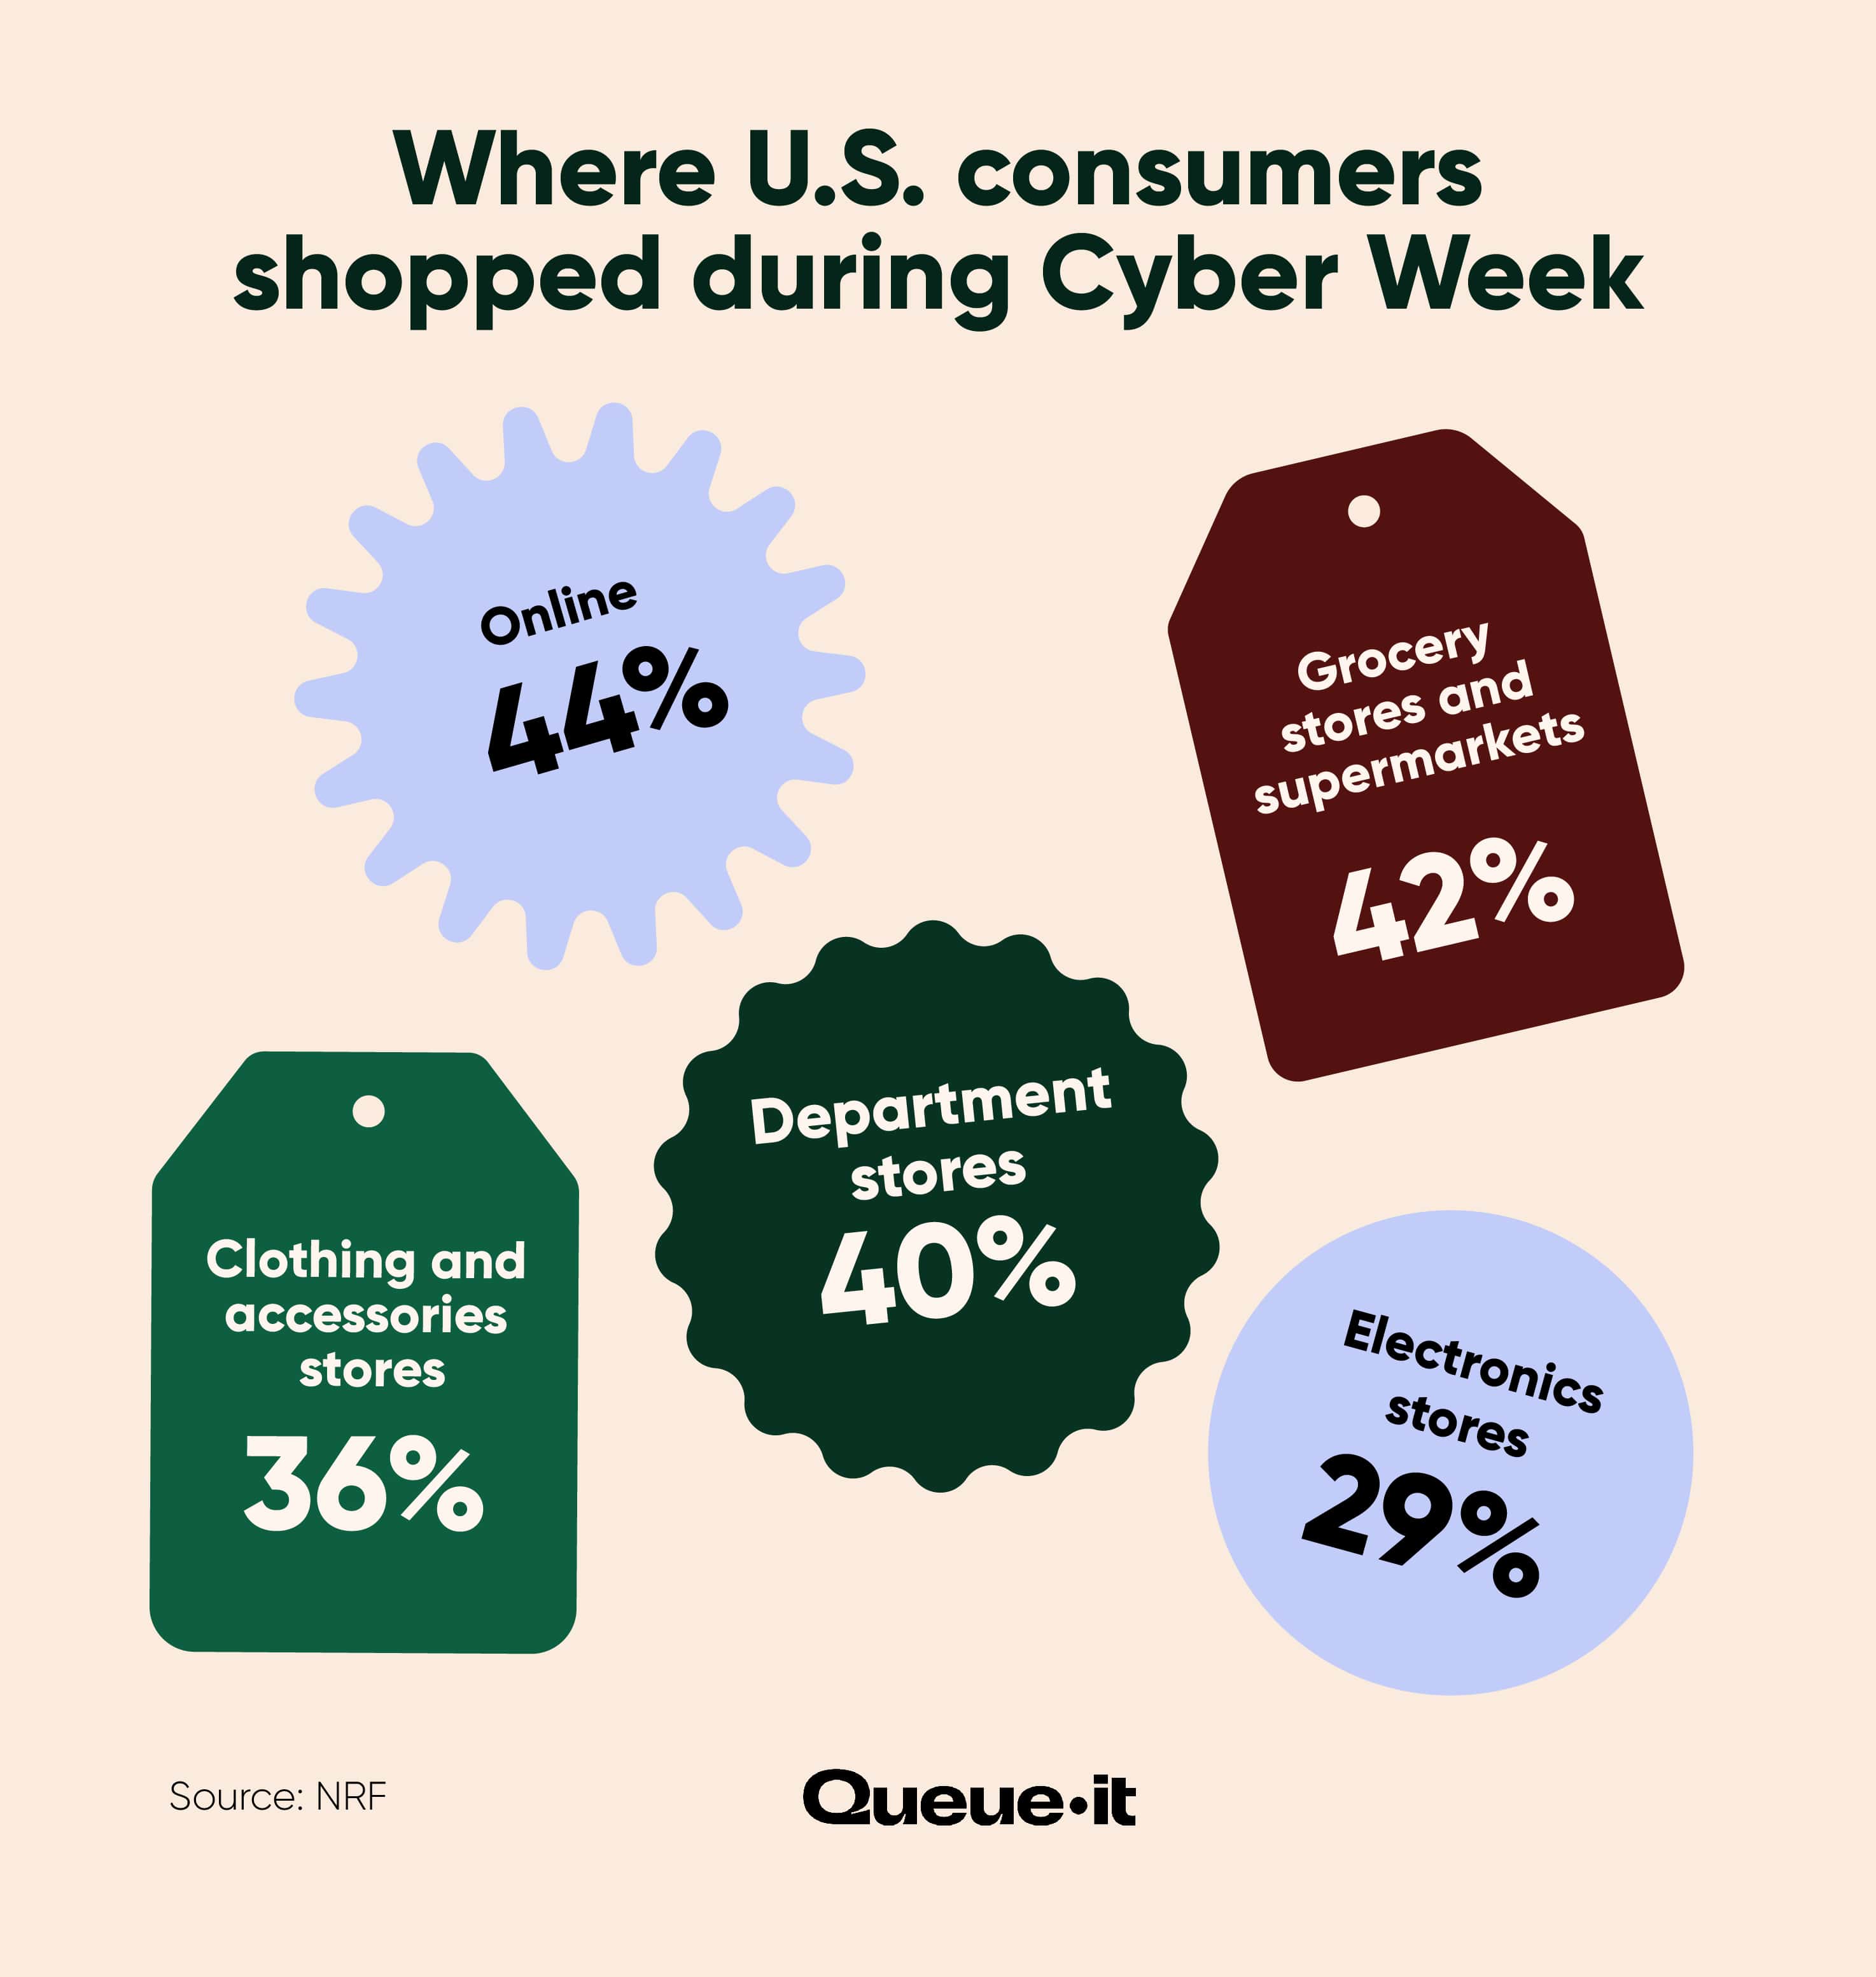
- The top destinations for Cyber Week shoppers in 2023 were:
- Online (44%)
- Grocery stores and supermarkets (42%)
- Department stores (40%)
- Clothing and accessories stores (36%)
- Electronics stores (29%)
- 95% of Cyber Week shoppers made holiday-related purchases during five day period in 2023, down from 97% last year.
- Consumers spent $321.41 on average across Cyber Five 2023, consistent with $325.44 last year.
- Approximately 70% of Cyber Week spending ($226.55) in 2023 was spent specifically on gifts.
- The average spend on gifts, non-gifts, and experiences across the full Holiday Season increased to $1,652 (+14% YoY), compared to $1,496 in 2019.
- Among the $50K-$99K and $200K+ income groups, spending increased by $315 (+26%) and $709 (+22%) YoY, respectively.
- Consumers budgeted for an average of eight gifts in 2023, versus nine in 2022.
- They also planned on visiting fewer stores—4.2 in 2023, versus 5.9 in 2022.
- Planned spending on giftcards increased by 38% YoY to $300, while shoppers pulled back spending on food and beverage gifts.
- 75% of shoppers said they are tempted to self-gift, but constrained budgets may be a hurdle.
Discover how you can break Black Friday sales records without breaking your site

- Online retail traffic increased by 5% YoY during Cyber Week 2023.
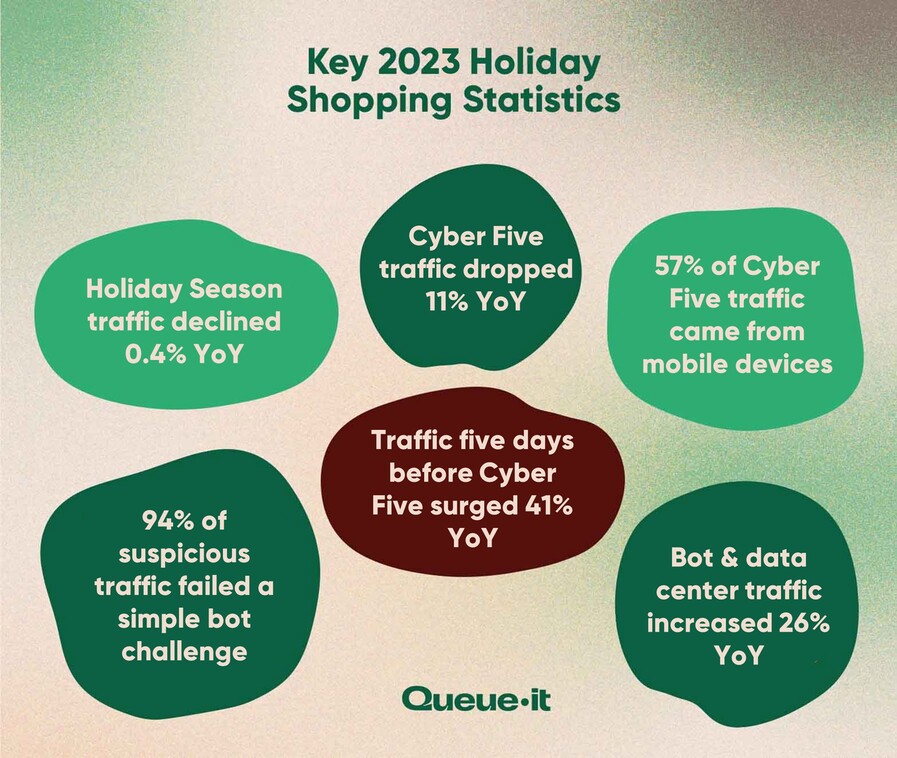
- Across the full 2023 Holiday Season, retail web traffic declined just 0.4% YoY—from 1.654 billion to 1.648 billion. That’s a decline of just 650k web visits across the 51 days, the smallest YoY change on record.
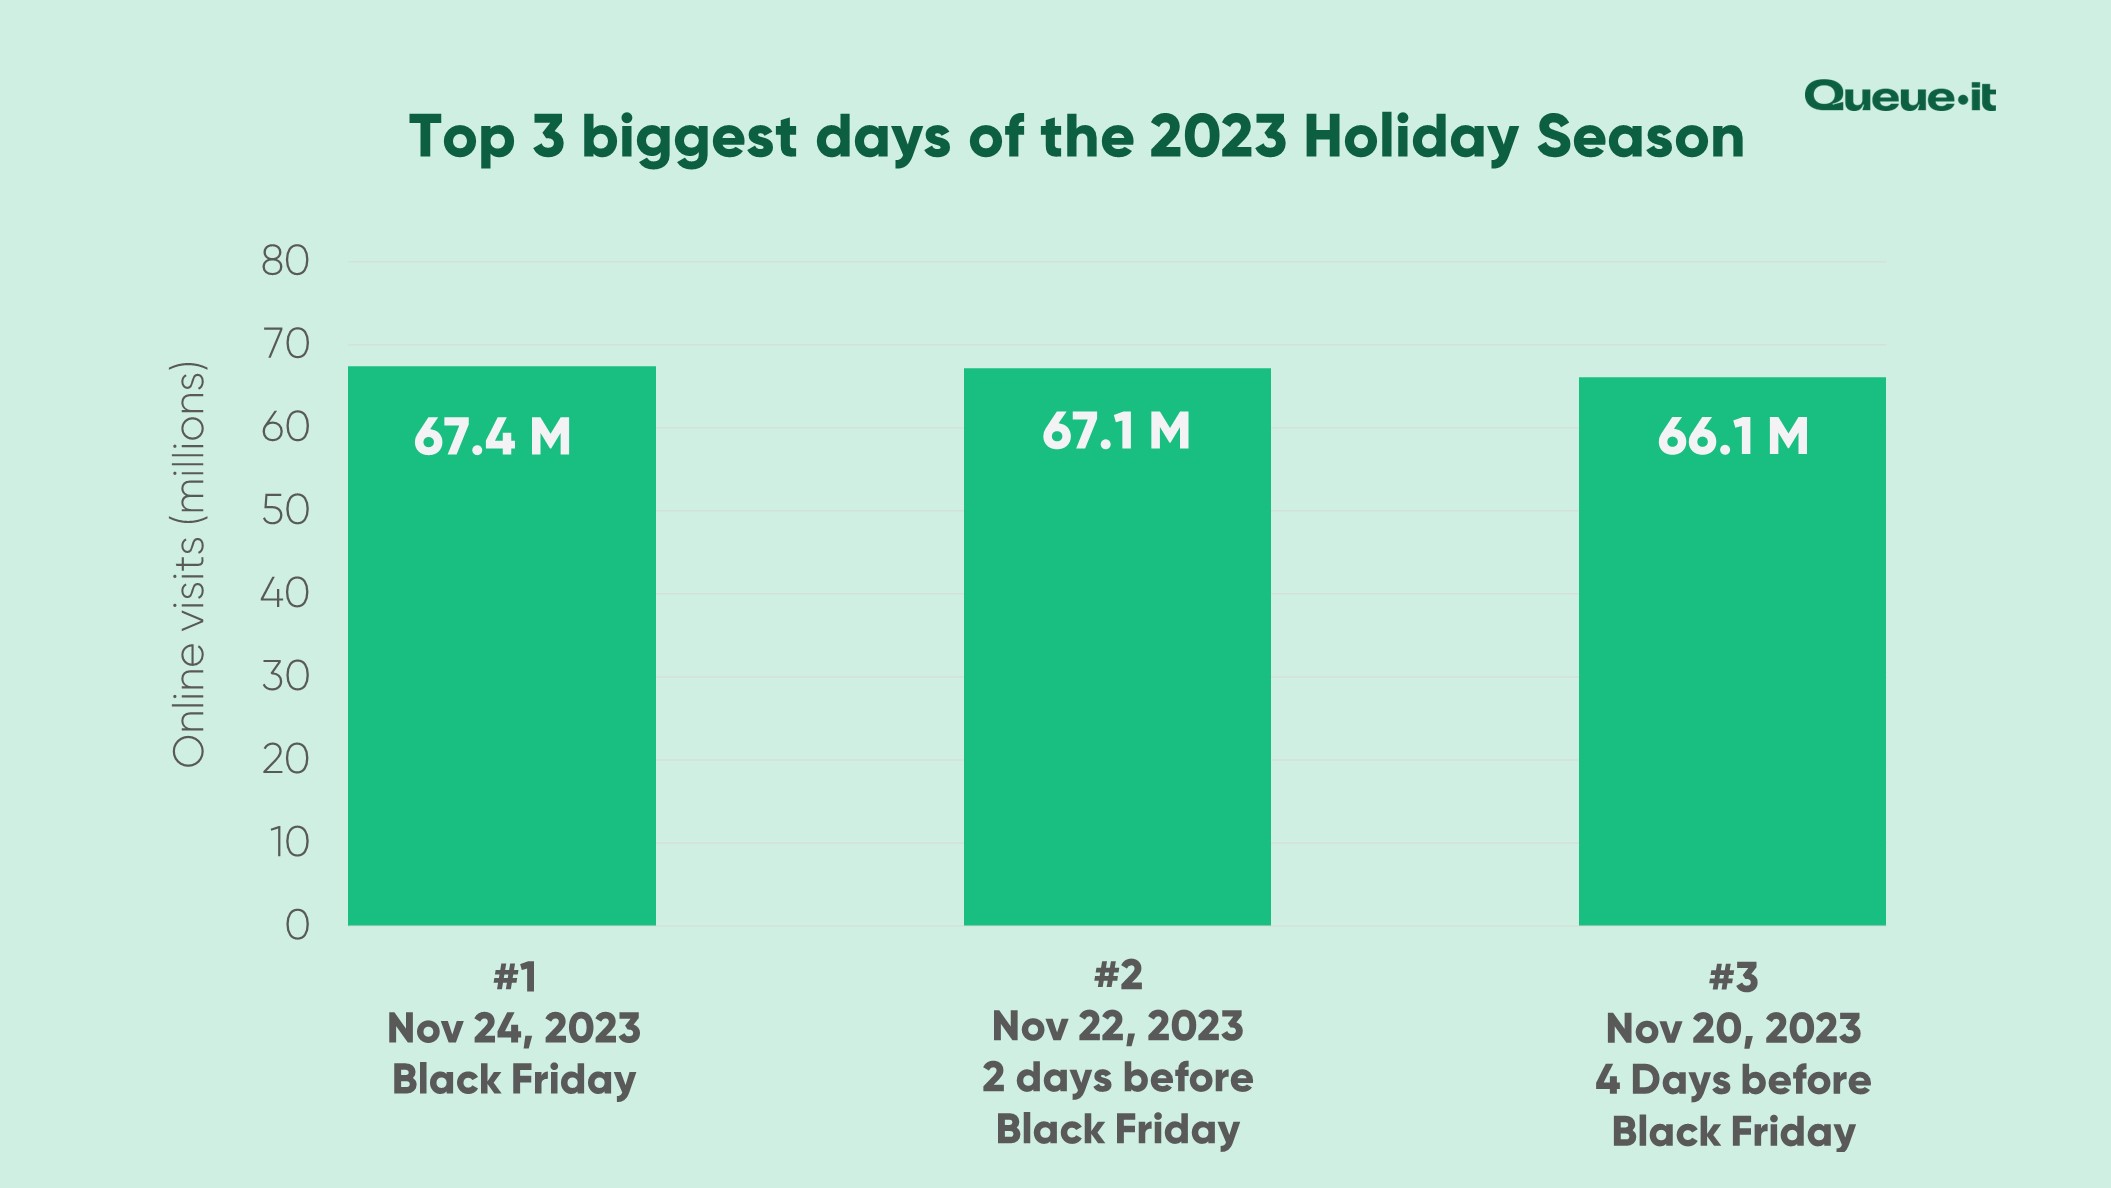
- The rise of early access sales saw Cyber Five dethroned as the biggest days for retail web traffic. Traffic from Thanksgiving to Cyber Monday (Cyber Five) totaled 291 million sessions. Traffic from November 18thto 22nd (the day before Thanksgiving) totaled 321 million—10% higher than Cyber Five.
- The five days prior to Cyber Five saw traffic surge 41% YoY. Meanwhile, Cyber Five traffic actually dropped by 11%.
- The biggest lift in traffic YoY came on the Friday before Black Friday, which shot up 63% YoY—from 32 to 52 million sessions.
- The Monday before Black Friday also increased an impressive 58% YoY—from 34 to 54 million sessions.
- Here’s the year-over-year breakdown of the Cyber Five retail web traffic in 2023:
- Thanksgiving: -7%
- Black Friday: -18%
- Small Business Saturday: -13%
- Cyber Sunday: -9%
- Cyber Monday -6%
RELATED: 2023 Holiday Shopping Statistics: Data From 2.4 Billion Retail Web Visits
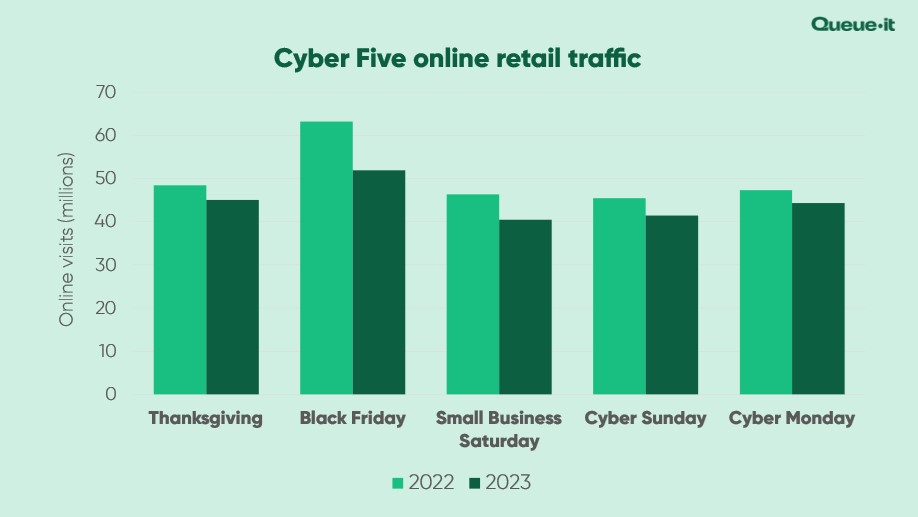
- Across Cyber Five, Black Friday saw the biggest losses in traffic—declining by almost 20% YoY—while Cyber Monday saw the smallest decline, losing 6% of its traffic.
- Despite Black Friday’s YoY decline, it remains the biggest day of the year for online retailers, with 67.4 million sessions—just 300k more than the Friday before Black Friday.
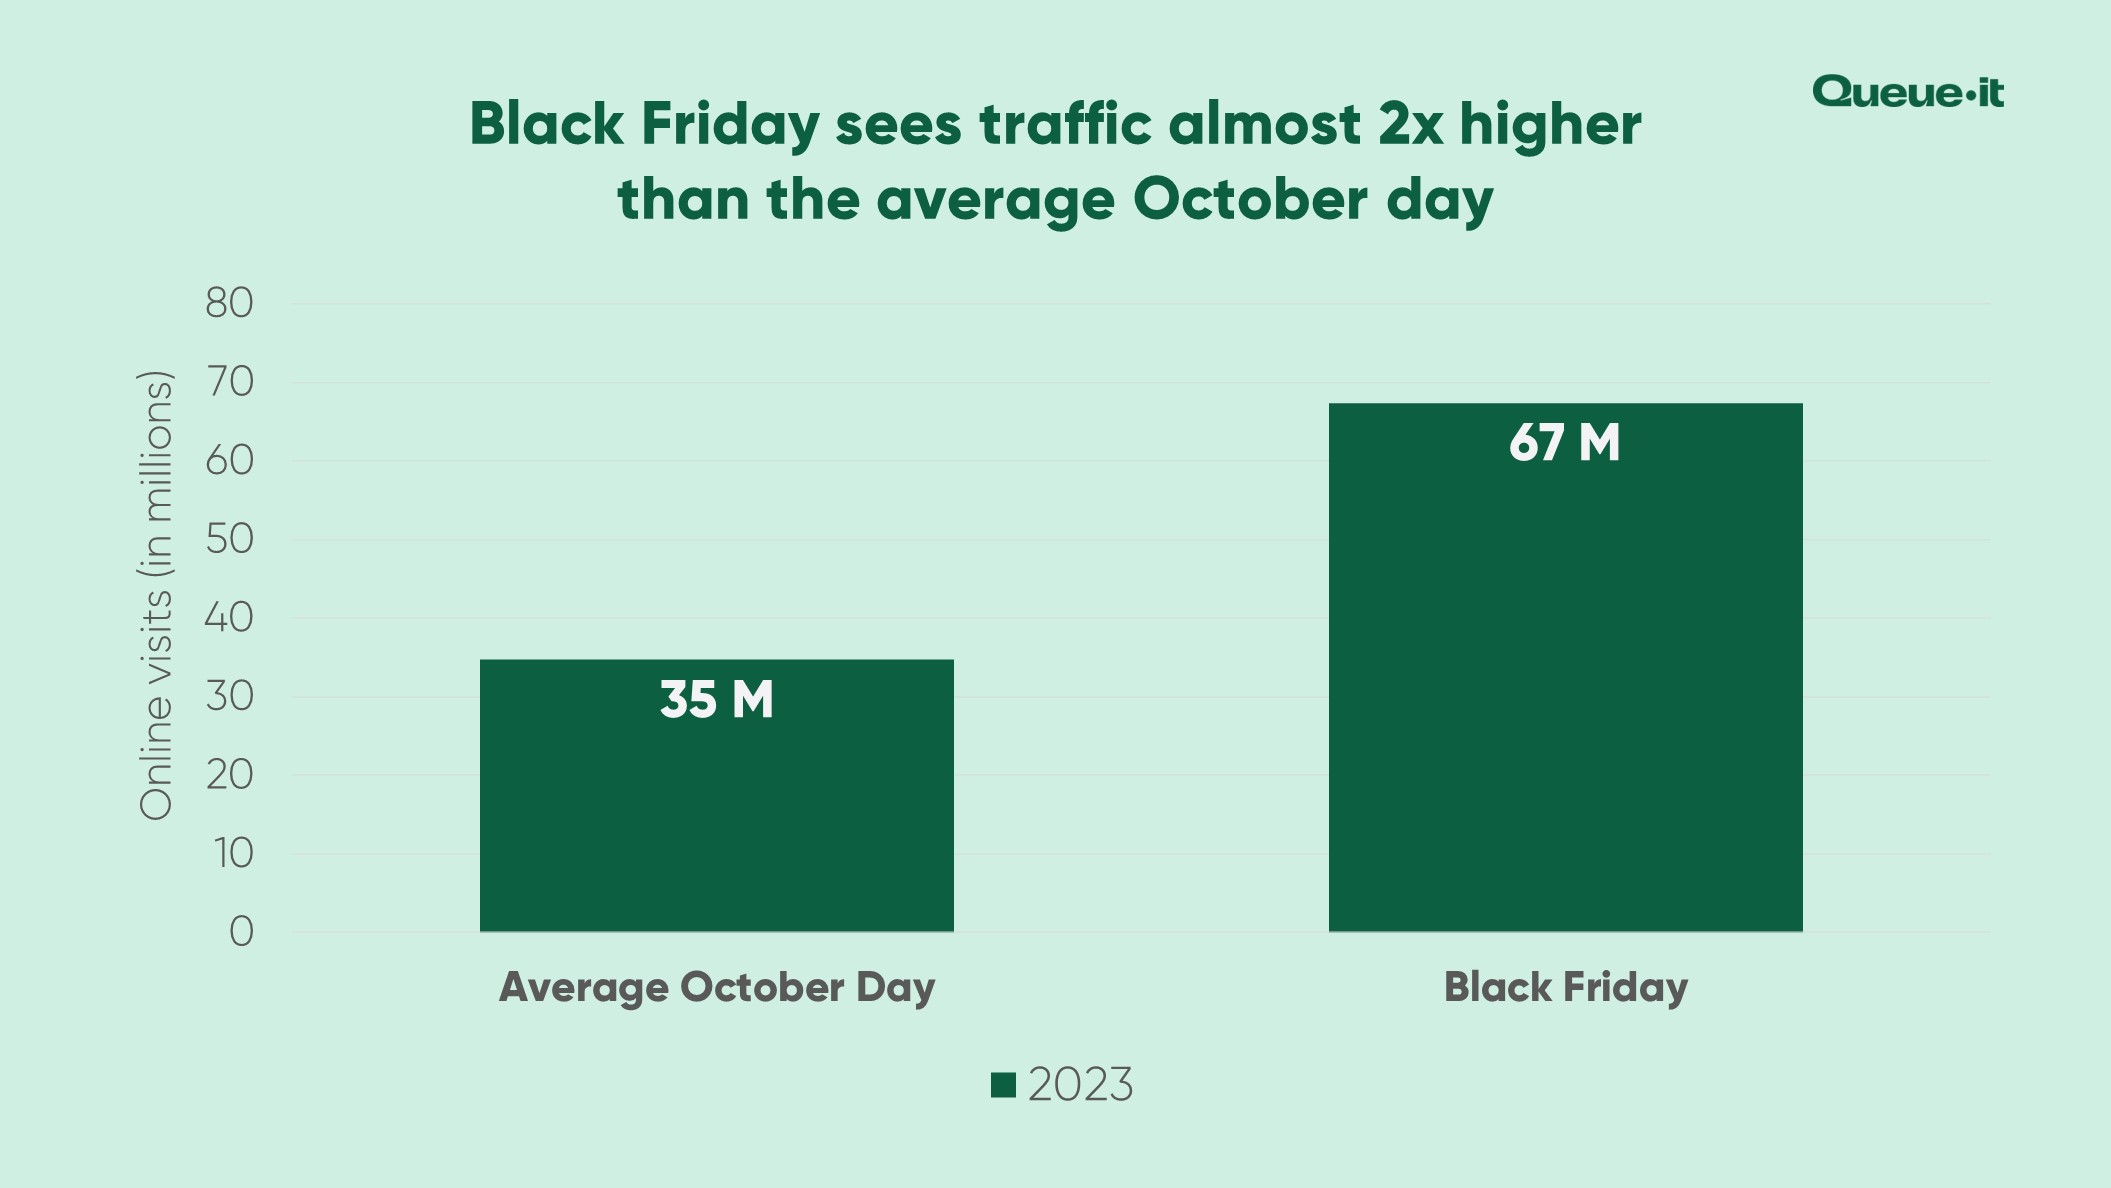
- Traffic on Black Friday in 2023 was almost double that of the average October day—a decline from last year, where Black Friday traffic was 3x that of the average Oct day.
RELATED: How Currys Used Queue-it to Handle Over 1 Million Black Friday Shoppers
- Electronics was the biggest category driving retail web traffic across the 2023 Holiday Season:
-
- Electronics: 53% (1.3 billion visits)
- Apparel & accessories: 16% (386 million visits)
- Health & beauty: 12% (290 million visits)
- Food & drug: 6% (156 million visits)
- Toys & hobbies: 4% (87 million visits)
- Home & appliances: 3% (75 million visits)
- Department store: 3% (71 million visits)
- Other (including jewelry, hardware & home improvement, auto parts & accessories, sporting goods, and more): 3% (71 million visits)
- Three out of every five retail web sessions during Cyber Five 2023 came from mobile devices (57%).
- Desktop was the second most popular traffic source, at 33%.
- Tablets came in third, making up just 1% of traffic.
- Almost 1 in 10 sessions (9%) came from an unknown device, which typically occurs if the session comes from a data center, or the shopper is masking their device type with a VPN.
- Up to 29% of all Cyber Five traffic in 2023 was “bad traffic”—meaning traffic that came from bots and/or data centers, a 26% increase compared to 2022.
- In 2023, 21% of traffic requests came from data centers (up from 17% in 2022), and 8% of traffic was unusual requests (up from 5%).
- Data center traffic peaked on Cyber Monday, where it accounted for 28% of all requests.
- Across Cyber Five, 94% of the suspicious traffic Queue-it challenged failed to pass the challenge. That’s almost 3 million bots blocked.
Different sources say different things about the exact volume of mobile traffic and sales across Black Friday and Cyber Week. But while the numbers are different, the story is the same, mobile reached new heights in 2023, and isn’t going anywhere:
- A record-breaking 79% of Cyber Week ecommerce traffic came from mobile phones in 2023, up from 76% in 2022 (per Salesforce).
- 57% of Cyber Week ecommerce traffic came from mobile phones in 2023, up from 53% in 2022 (per Queue-it).
- Thanksgiving was the biggest day of Cyber Week for mobile traffic, with 66% of all sessions coming from mobile (per Queue-it). This tracks with Adobe’s spend data, which also found Thanksgiving was the biggest day of the season for mobile—with 59% of online sales coming through a smartphone.
- On Cyber Monday, just 50% of traffic came from mobile (per Queue-it).
- Black Friday was the biggest day of Cyber Five for mobile traffic, with 55.3% of sessions occurring on mobile devices (per Cloudflare).
- 38% of online sales during Cyber Week came from mobile devices, a slight increase from last year (per Big Commerce).
- 51.8% of online sales during Cyber Week came from mobile devices, up from 49.9% in 2022 (per Adobe).
- Across the whole season, 51.1% of online sales came through smartphones (up from 47% in 2022).
More than 50% of Holiday Season sales came from mobile devices.
- Mobile shopping was highest on Christmas Day (Dec. 25) driving 63% of online sales (61% in 2022).
- Installs of “Deal discovery” mobile apps during Black Friday were 113% higher than the November average.
- Sessions on ecommerce apps during Black Friday grew 20% YoY.
- 44 million U.S. consumers used their home desktop or laptop to shop online on Cyber Monday. Another 40.5 million shopped online using their mobile devices, down from a record 45.7 million in 2022 but still well above pre-pandemic levels (per National Retail Federation).
- Black Friday conversion rates were 6.5% on desktop and 3.2% on mobile.
- On Black Friday, the average items per order were 3.6 on desktop, 2.9 on smartphone, and 2.9 on tablet.
RELATED: How to Nurture Loyalty & Optimize Web Performance This Holiday Season [Webinar]
- 28% of shoppers planned to use buy online, pick up in-store (BOPIS) to buy gifts this in 2023, versus 35% in 2022.
- BOPIS was used in 18.4% of online orders in 2023, among retailers that offer the service (21% in 2022).
- BOPIS peaked from Dec. 22 to Dec. 23 (right before Christmas Eve), driving 36.8% of online orders.
- On average, 55% of Cyber Week purchases were specifically driven by sales and promotions, up from 52% in 2022.
- 31% of shoppers said a limited-time sale or promotion convinced them to make a purchase they were hesitant about, up from 29% last year.
- Shoppers said they'd allocate 37% of their Holiday Season budgets to shopping in-store in 2023 (versus 35% in 2022).
- Online-only retailers (63%) and mass merchants (53%) were the most preferred shopping destinations.
Online-only retailers were the most preferred shopping destinations across the 2023 Holiday Season.
- Department stores are most popular among high spenders (40% versus 18% others).
- Online shoppers have an average willingness to spend $40 to qualify for free shipping.
- Sustainable products and packaging are a priority for over half of younger shoppers.
- 79% of consumers have little to no trust in retailers’ ability to use artificial intelligence responsibly.
- Shoppers planned to spend almost a third their budgets in the last two weeks of November, with 78% shopping during that period.
- The shopping duration has shrunk to an average of 5.8 weeks in 2023 (versus 7.4 weeks in 2019), leaving retailers with a smaller window to engage customers.
- 24% of consumers planned to shop early during October sales events.
- 66% of shoppers say they’ll shop during Cyber Five to combat increasing prices (compared to 49% in 2022).
- Three in 10 people said they considered Black Friday sales to be good value.
- 34% of consumers said while Black Friday offers good value, it's not always worth the hassle of shopping on that day.
- 24% of shoppers said they believe retailers inflate the prices in the lead-up to Black Friday and discounted them on the day of the event.
- 73% of men say they think Black Friday is a great chance to score a deal, compared to 67% for women.
- 23% of women say they suspect retailer inflate their prices ahead of Black Friday, only to “discount them” on the day.
- 84% of Gen Z consumers say Black Friday sales are good value.
- 27% of holiday shoppers are high spenders and are responsible for 68% of total holiday spending.
- High spenders are evenly split between men and women, 27-59 years old (58%), and with an annual income greater than $100K (61%).
- High spenders planned to spend $2,146 or more on average this season, purchasing 10 gifts (versus others buying eight gifts).
- They are more likely to shop for electronics (67% versus 46% others) and health and wellness (62% versus 41% others).
- They spend nearly 3x on experiences, compared to the average holiday shopper.
- Higher-income groups plan to participate during BFCM week at higher rates than lower-income ones.
- Almost three-quarters of higher-income earners planned to shop online on Black Friday. Approximately the same proportion of higher earners also planned to make purchases on Cyber Monday.
- Gen Z was the generation that regretted their past Black Friday purchases the most, with 60% of Gen Z respondents reporting regret. Baby Boomers were the only generation that reported no regret around Black Friday purchases.
60% of Gen Z shoppers regret Black Friday purchases.
- In a 2023 U.K. survey, no consumers said that they did not know Black Friday. One third of U.K. consumers said that they knew the event very well.
- Half of U.K. respondents said that best value for money and low prices were the most important criteria that influenced their decision on where they shop on Black Friday.
- U.K. residents from Greater London planned to spend the most on Black Friday, averaging over 181 British pounds, followed by Wales and the West Midlands. In contrast, those surveyed from the South West were likely to spend the least, averaging just over 60 pounds.
- British men (£129) expected to spend more on Black Friday 2023 than women (£98).
- In the U.K., Generation Z were likely to be the biggest spenders on Black Friday 2023, with a planned spend of 176 pounds on average. This planned spend decreased with each generation.
- For Cyber Five 2023, 46% of consumers in the U.K. planned to shop for electricals. Clothing and footwear was the second most popular category, with only slightly fewer consumers planning to purchase these items.
- European shoppers said they primarily looked for electronics products during the Black Friday sales events. Clothing and accessories were next on the list, followed by home appliances and décor.
- In 2023, over 30% of French consumers stated that they planned to spend less than the previous years for their Black Friday shopping. Slightly less than 20% of respondents in Italy and Spain said the same.
- Italians are the consumers who planned to shop exclusively online the most during Black Friday 2023, as stated by over 70% of respondents. Slightly over 50% of shoppers in Spain and France said the same.
- In 2023, nearly 20% of French consumers said they intended to seriously keep sustainability in mind when shopping during Black Friday. Meanwhile, only slightly more than 10% of consumers in Italy and Spain said the same.
- French consumers expected to spend 309 euros on Black Friday in 2023, the top amount of the three countries surveyed. Italian consumers said 273 euros, and Spanish consumers said 238 euros.
Break Black Friday sales records without breaking your site
- $51 billion of global online sales during Cyber Week 2023 were influenced by AI in areas such as targeted offers, product recommendations, and generative AI-powered chat services.
- 17% of all holiday orders were influenced by AI during the months of November and December, totaling $199 billion.
- Discount rates rose to 27% globally and 29% in the U.S. on average throughout Cyber Week—representing the best deals of the Holiday Season. The verticals with the highest global discount rates were:
- Makeup (38%)
- General Apparel (33%)
- Skincare (33%)
- Active Apparel (32%)
- Return rates in 2023 returned to 5% after an abnormally high rate of returns in 2022.
- Single-brand retailers in the U.S. grew their online sales by 7% YoY, more than double rate of retailers carrying multiple brands (3% YoY).
- Across the Holiday Season, Buy Now, Pay Later (BNPL) usage hit an all-time high in 2022, contributing $16.6 billion in online spend, up 14% YoY, a $2.1 billion increase over 2022.
- November was the biggest month on record for BNPL, at $9.2 billion, up 17.5% YoY. Cyber Monday was the biggest day on record, at $940 million, up 42.5% YoY.
- Use of BNPL grew 8% YoY in the U.S. during Cyber Week 2023.
- Use of mobile wallets (such as Apple Pay) surged by 54% YoY in the U.S. during Cyber Week 2023.
- Chatbot messages across Cyber weekend increased by 79% YoY globally.
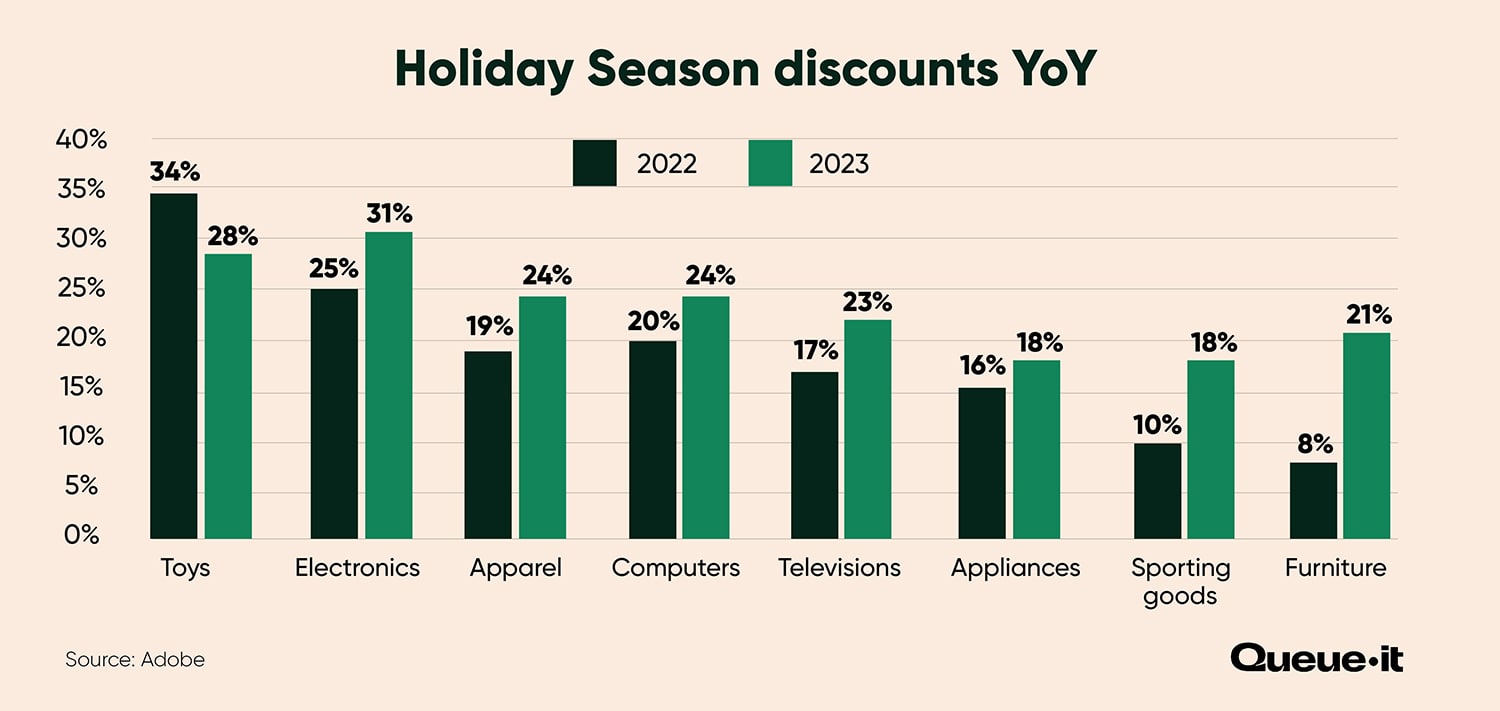
- Across major ecommerce categories, discounts hit record highs this Holiday Season:
- Electronics: 31% (vs 25% in 2022)
- Toys: 28% (vs 34%)
- Apparel: 24% (vs. 19%)
- Computers: 24% (vs 20%)
- Televisions: 23% (vs 17%)
- Appliances: 18% (vs 16%)
- Sporting goods: 18% (vs 10%)
- Furniture: 21% (vs 8%)
- The number of messages sent via push notifications, SMS, and streaming services combined grew 37% this Cyber Week—compared to just 9% growth for traditional email.
- Social media drew 5x more online traffic this Holiday Season compared to email and digital advertising combined.
- Traffic coming from social media grew by 7% YoY during the Holiday Season—accounting for 10% of all mobile traffic referrals globally.
- Marketing investments drove large sales volumes for retailers across the season:
- Paid search: 29.4% of online sales
- Direct web visits: 19.3% of online sales
- Affiliates and partners: 16.6% of online sales
- Organic search: 15.9% of online sales
- Email: 15.3% of online sales
- Social media: 3.5% of online sales
- A little over half of consumers (55%) took advantage of early holiday sales and promotions.
- 35% of consumers shopped specifically in the week leading up to Thanksgiving (Nov. 16-22).
- Similar to last year, as of Cyber Week, 85% of consumers had started holiday shopping and were about halfway (48%) through their shopping plans.
RELATED: How to Use Scarcity Marketing & Product Drops for Black Friday Success
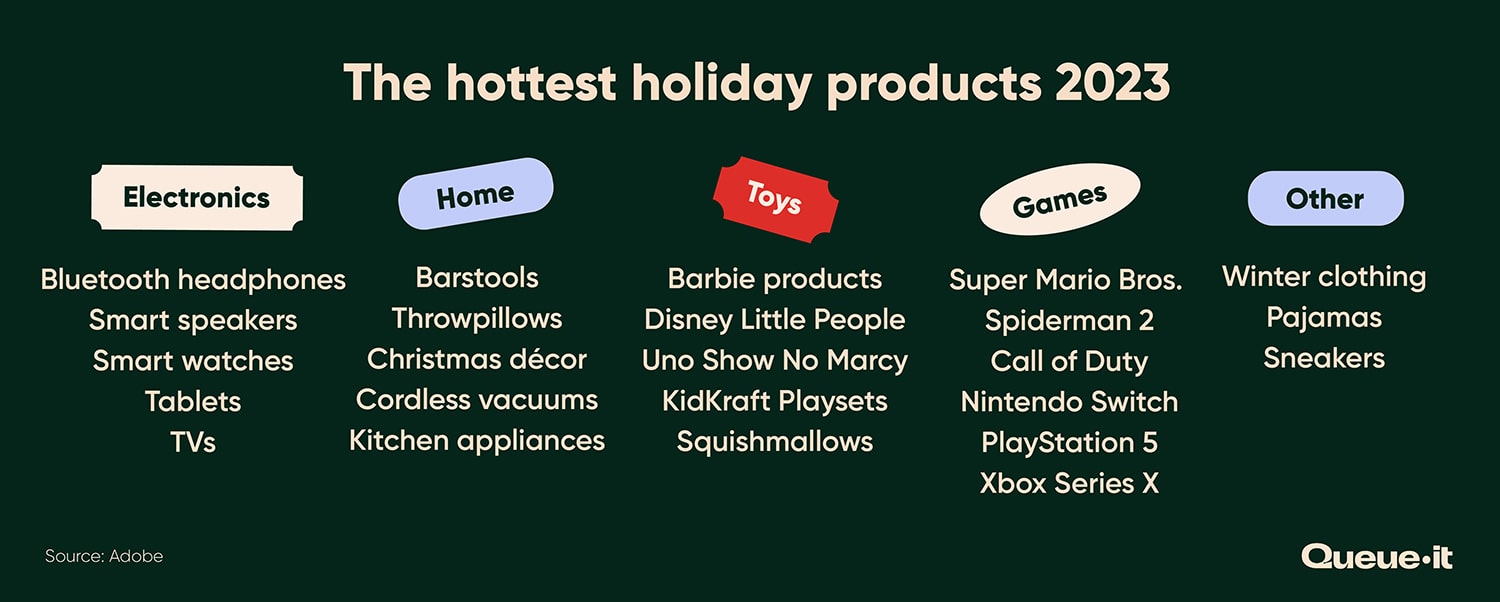
- Adobe Analytics’ top products of the Holiday Season include: TVs, smart speakers, pajamas, barstools, Barbie products, video games and consoles, robot vacuums, and skin care.
- Of the $222.1 billion spent online in the 2023 Holiday Season, over half (65%) was driven by five categories:
- Electronics ($50.8 billion)
- Apparel ($41.5 billion)
- Furniture ($27.3 billion)
- Groceries ($19.1 billion)
- Toys ($7.7 billion)
- The top gifts shoppers purchased during the five-day period were:
- Clothing and accessories (bought by 49% of those surveyed)
- Toys (31%)
- Gift cards (25%)
- Books, video games and other media (23%)
- Personal care or beauty items (23%)
- The National Retail Federation predicts that holiday spending in 2024 will grow 2.5-3.5% YoY in 2024, reaching around $985 billion.
- Online shopping is expected to increase 8-9% YoY in 2024, reaching around $296 billion in sales.
- Adobe predicts online spending will reach a record $241 billion during the 2024 Holiday Season, an 8.4% lift from 2023.
- Shopping on mobile devices is expected to reach record highs in 2024, contributing $128 billion and growing 12.8% YoY.
Online shopping is expected to increase 8-9% YoY in 2024, reaching around $296 billion in sales.
- Adobe predicts Cyber Monday will be the biggest day of the 2024 Holiday Season, growing 6.1% YoY to reach $13.2 billion.
- Black Friday 2024 is expected to grow 9.9% YoY, reaching $10.8 billion.
- Discounts are predicted to peak at 30% off listed prices during the 2024 Holiday Season, compared to 31% in 2023.
- Over half of the 2024 Holiday Season spend is expected to be driven by electronics (8.5% YoY increase to $55.1 billion), apparel (5.8% YoY increase to $43.9 billion), and furniture/bedding ($28.4 billion, up 4.2% YoY).
- The average expected holiday spend in 2024 is predicted to reach $1,778, up 8% YoY.
- The average spend on retail categories is expected to remain flat in 2024 ($1,043 in 2024 versus $1,020 in 2023) with gifts relatively flat (-3% YoY) and an uptick in non-gift purchases (+9%).
- On average, holiday budgets are 32% higher in 2024 than in 2023.
- 32% of shoppers say they’ll begin their Holiday Season shopping for 2024 between July and October.
- Only 14% of U.S. shoppers plan to spend more in 2024 than in 2023, with 21% of consumers saying they’ll reduce their spending.
- Consumers are increasingly concerned that in-store prices are not competitive with online prices, with 20% of consumers saying they’ll increase their online spend in 2024.
- 43% of consumers expect the economy to improve next year (versus 34% in 2023).
- 70% of consumers surveyed expect higher retail prices during the 2024 Holiday Season, consistent with 2023 expectations.
- High-income earners (with salaries ranging from $100k to $199k) plan to spend 17% more during the 2024 Holiday Season than they did in 2023.
- Only 32% of respondents plan to buy self-gifts in 2024 (versus 48% in 2023).
- Online retailers (71%) and mass merchants (55%) are expected to be consumers’ top locations to shop due to price and convenience.
- The top characteristics of items consumers want in the 2024 Holiday Season are quality (39%), value (37%), and variety (35%).
- Four in 10 consumers plan to give experiential gifts in 2024.
- 48% of consumers plan to shop on smartphones this Holiday Season, while 13% plan to purchase on social media.
- Across all income groups, at least 40% are showing five or more signs of frugal behavior.
- Loyalty may be at risk as consumers expect to seek to more affordable retailers (48%), switch to lower-priced brands (62%), or seek out knockoff or “dupe” goods (25%).
- Participation in early October promotional events is expected to increase (38% versus 24% in 2023), but the bulk of holiday shoppers (75%) are expected in the second half of November.
- 68% of respondents plan to shop during Thanksgiving week (versus 66% in 2023); intent to participate is highest among Gen Z and millennials (79%).
- Spending on experiences is expected to increase 16% YoY during the 2024 Holiday Season.
- Shoppers plan to spend an average of $1,638 on gifts, travel and entertainment this holiday season, marking a 7% increase from 2023 and a 15% jump from 2022.
- Nearly three in 10 consumers (29%) plan to spend less in 2024 compared to the 2023 season—up 10% from last year.
- Gen Z’s holiday budgets have grown by 59% over the past two years, while millennial spending has increased just 22%.
- 52% of consumers who have not yet completed their holiday shopping plan to do so after Thanksgiving.
- In 2024, 3% more consumers plan to shop on Black Friday than in 2023.
- 57% of consumers describe their financial description as strained ahead of the 2024 Holiday Season.
- 85% of consumers are considering cutting back on nonessentials like dining out, clothing, and luxury items over the next six months.
50% of Gen Z consumers now use Generative AI channels to help with their ecommerce purchases.
- Consumers are increasingly purchasing resale/used goods (45% versus 38% in 2023).
- 40% of Gen Z consumers say that celebrity and influencer endorsements are an important factor for their holiday shopping decisions.
- Debit cards will remain the most popular payment method during the 2024 Holiday Season, with 65% of consumers paying with this method.
- 50% of Gen Z consumers now use Generative AI channels during the consideration stages, compared to just 29% of baby boomers.
- 60% of consumers plan to visit stores in person to make Holiday purchases. But while baby boomers prefer in-store shopping, Gen Z and millennials are more likely to shop with mobile apps.
- 82% of consumers prefer home delivery for online shopping during the Holiday Season.
- 64% of Gen Z and millennial consumers are likely to buy gifts that support a cause this Holiday Season, compared to 55% overall.
- 71% of shoppers say they’ll use two or more channels to do their holiday shopping, with just 13% saying they’ll exclusively use home delivery.
- 83% of consumers plan to self-gift during the 2024 Holiday Season (compared to 76% in 2023).
- More than 81% of consumers say they’ll use social media to inform their holiday shopping decisions, a 12 percentage point increase from 2023.
- Cyber Week (also known as Cyber Five or Thanksgiving weekend) describes the five days from Thanksgiving in the U.S. (Thursday), through to Cyber Monday. It’s made up of Thanksgiving, Black Friday, Small Business Saturday, Sunday (which doesn’t have a name), and Cyber Monday.
- The Holiday Season shopping period is generally defined as the period from Nov. 1 through to Dec. 31.
- The statistics in this article come from a wide range of sources including (but not limited to) Adobe Analytics, Salesforce, Mastercard, the National Retail Federation, and Queue-it. Each of these organizations has different data sources, so exact numbers may differ in some instances.