
Discover the latest Black Friday statistics and trends you need to know to prepare for the West’s biggest shopping holiday. Uncover Black Friday sales volumes, consumer trends, retail marketing strategies, the hottest product categories, and more.
It’s the biggest shopping day of the year for retailers across the globe. People queue online and offline from the crack of dawn for doorbuster deals. Billions upon billions of dollars are spent—both by consumers and retail marketers. And it’s tough to find a single retailer who doesn’t take part.
It is, of course, Black Friday.
But what’s all the Black Friday fuss about? Just how much do consumers spend? What are retailers doing to ensure successful sales? And how is Black Friday—and the whole Holiday Season shopping period—changing?
The answers to these questions can be tough to find. So we’ve scoured the web for you and gathered 149 of the most impressive and surprising Black Friday statistics that show just how important Black Friday is for retailers.
Uncover the changes in consumer buying patterns, the marketing techniques driving the most sales, the technological developments that are defining Black Friday shopping, and the top categories customers shop on the day.
Want to jump straight into the Black Friday 2025 statistics, predictions, and consumer survey data? Click here for 2025 Black Friday stats.
Table of contents
- Black Friday sales volume
- Black Friday shopper statistics
- Black Friday consumer spending statistics
- Black Friday online traffic statistics
- Black Friday mobile shopping statistics
- Black Friday consumer trends
- Black Friday statistics global
- Black Friday retail trends
- Black Friday top product categories
- Black Friday 2025 statistics & predictions
- Definitions & sources
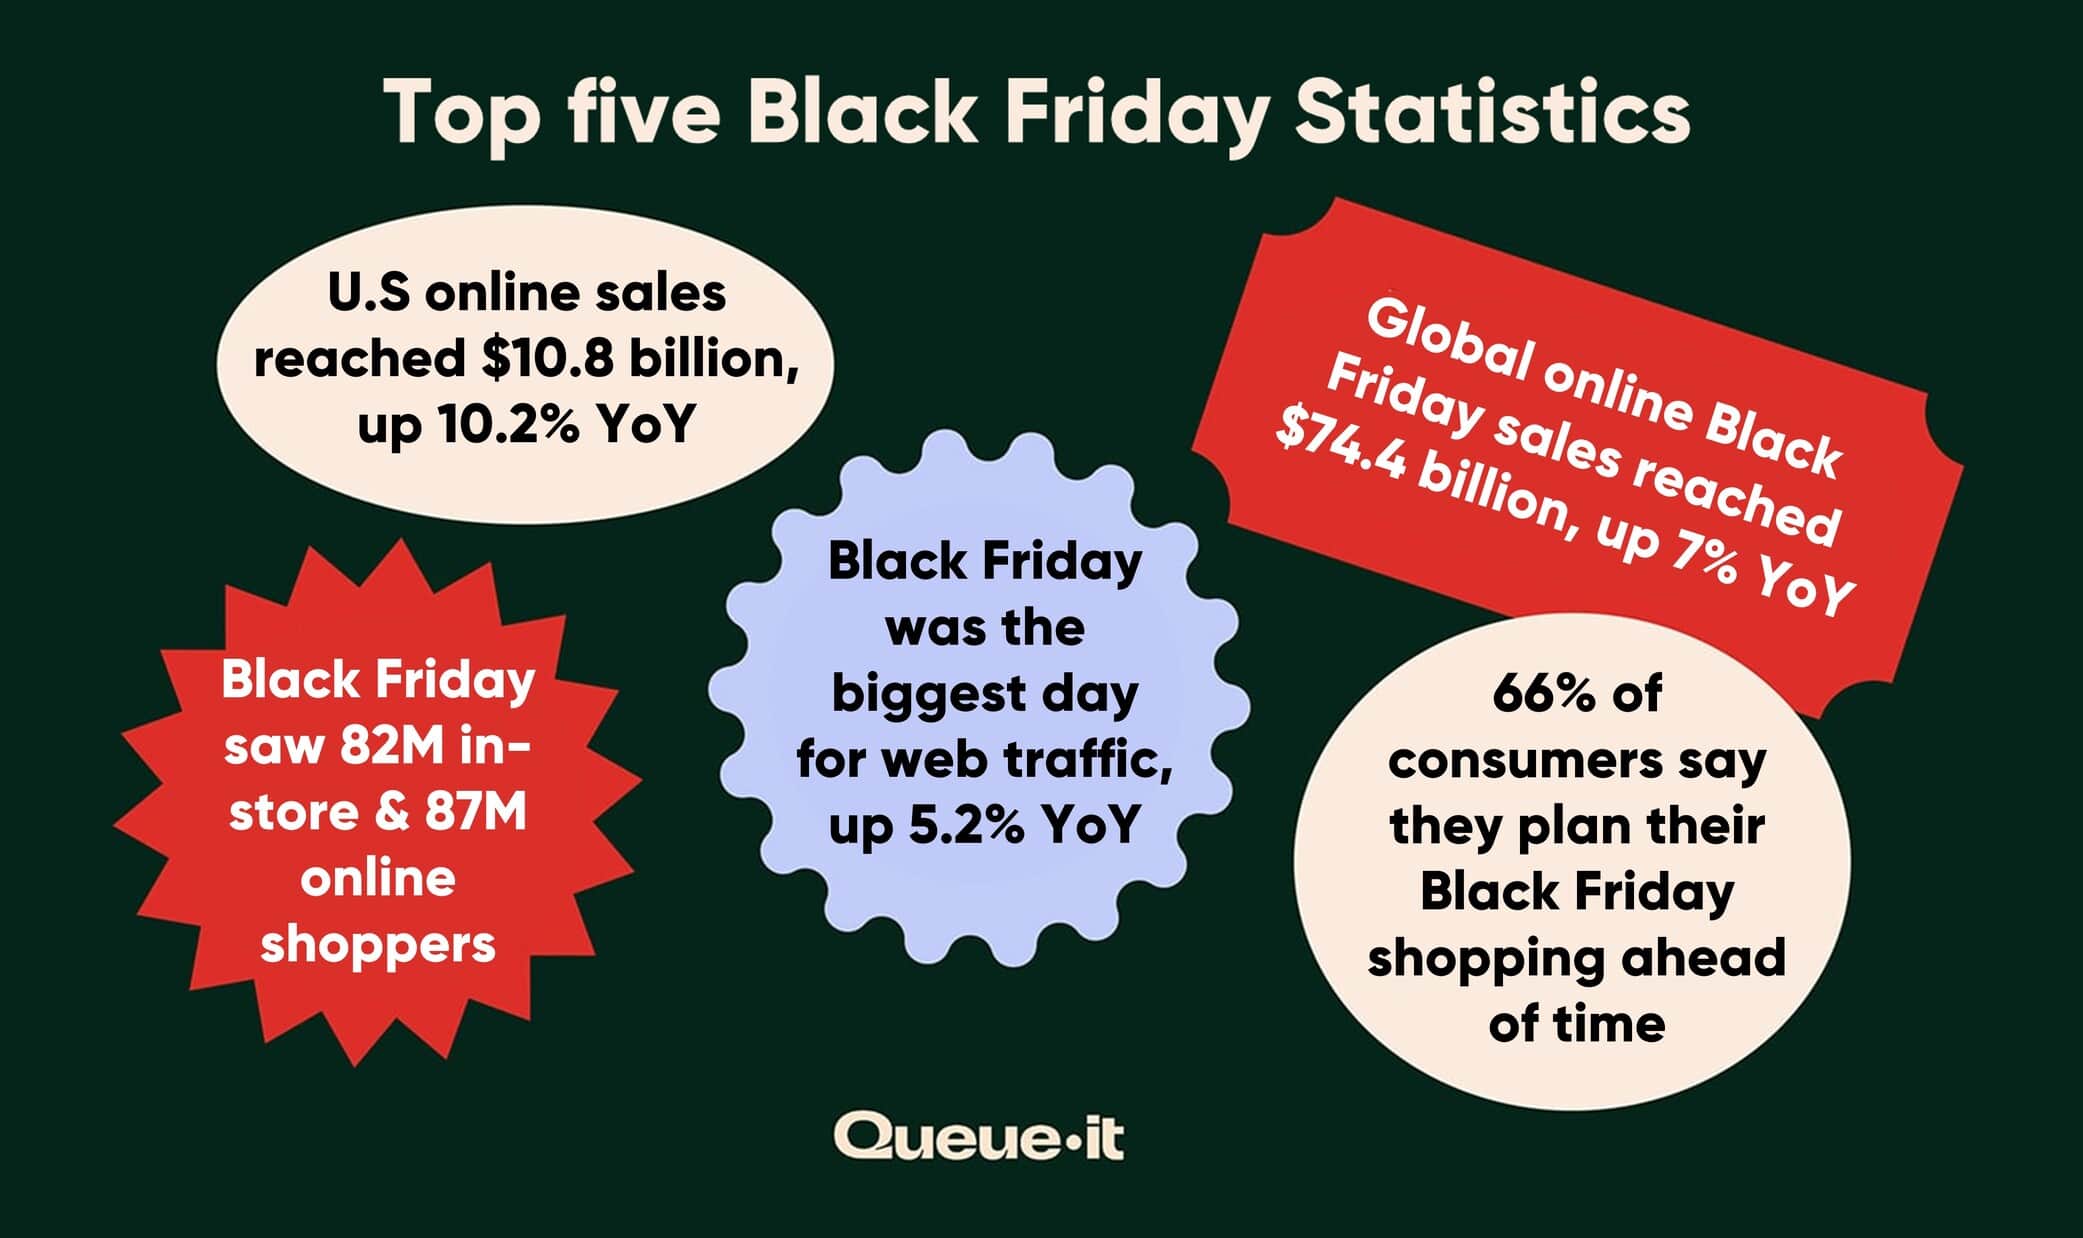
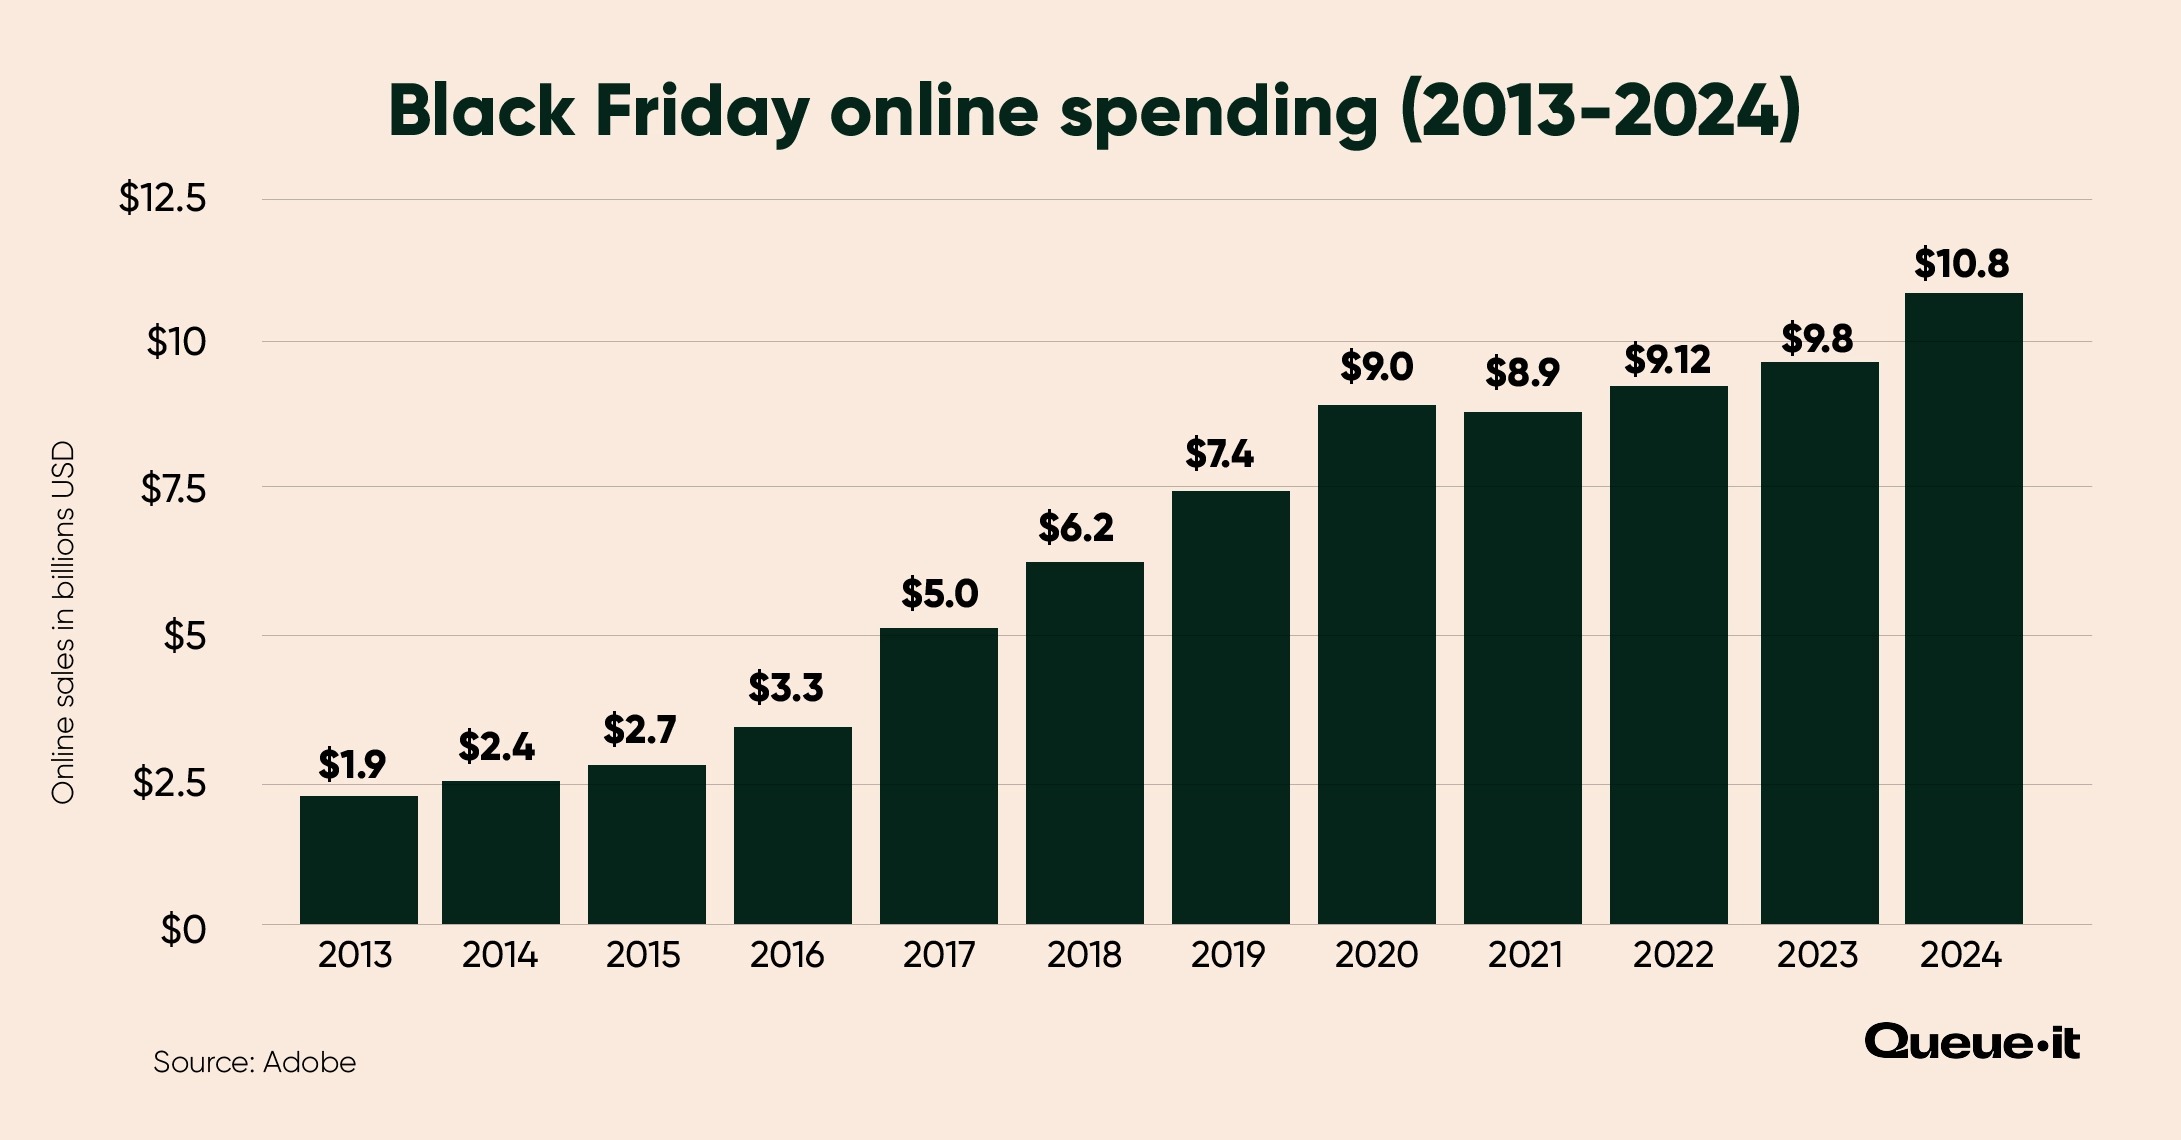
- U.S. consumers spent $10.8 billion online during Black Friday 2024, up 10.2% (per Adobe).
- Adobe predicts that Black Friday sales will rise again in 2025, by 8.3% to $11.7 billion.
- Black Friday 2024 drove $74.4 billion in global online sales, a 7% YoY increase (per Salesforce).
- U.S consumers spent $17.5 billion during Black Friday in the U.S., a 7% increase (per Salesforce).
- Online sales during Black Friday in the U.S. increased by 14.6% YoY, per Mastercard.
- In-store sales grew a more modest 7% YoY.
- The 2024 Holiday Season saw a record $241 billion spent online, up 8.7% from last year.
- Cyber Week saw the biggest peak in sales, with $41.1 billion spent online in just five days.
- Cyber Week sales globally reached $315 billion, a 6% YoY increase.
- Cyber Week sales in the U.S. reached $76 billion, a 7% increase YoY (per Salesforce).
- Cyber Monday sales reached $49.7 billion globally, up 2% YoY.
- Cyber Monday was the biggest sales day of the season, with $13.3 billion in online sales (per Adobe).
- According to Salesforce, Cyber Monday sales reached $12.8 billion in the U.S., up 3% YoY.
- Black Friday was the most popular day for both in-store and online shopping, with 81.7 million consumers shopping in store and 87.3 million shopping online.
- Cyber Five saw an estimated 197 million shoppers, a small drop from 200.4 million.
- A total of 126 million consumers shopped in-store during Cyber Five, up from 121.4 million in 2023.
- Online shoppers totaled 124.3 million, down from 134.2 shoppers last year.
- 61.1 million consumers shopped in-store on Saturday, making it the second most popular day for in-store shopping.
- 64.4 million shopped online on Cyber Monday, making it the second most popular day for online shopping—but experiencing a significant drop from 2023 (73.1).
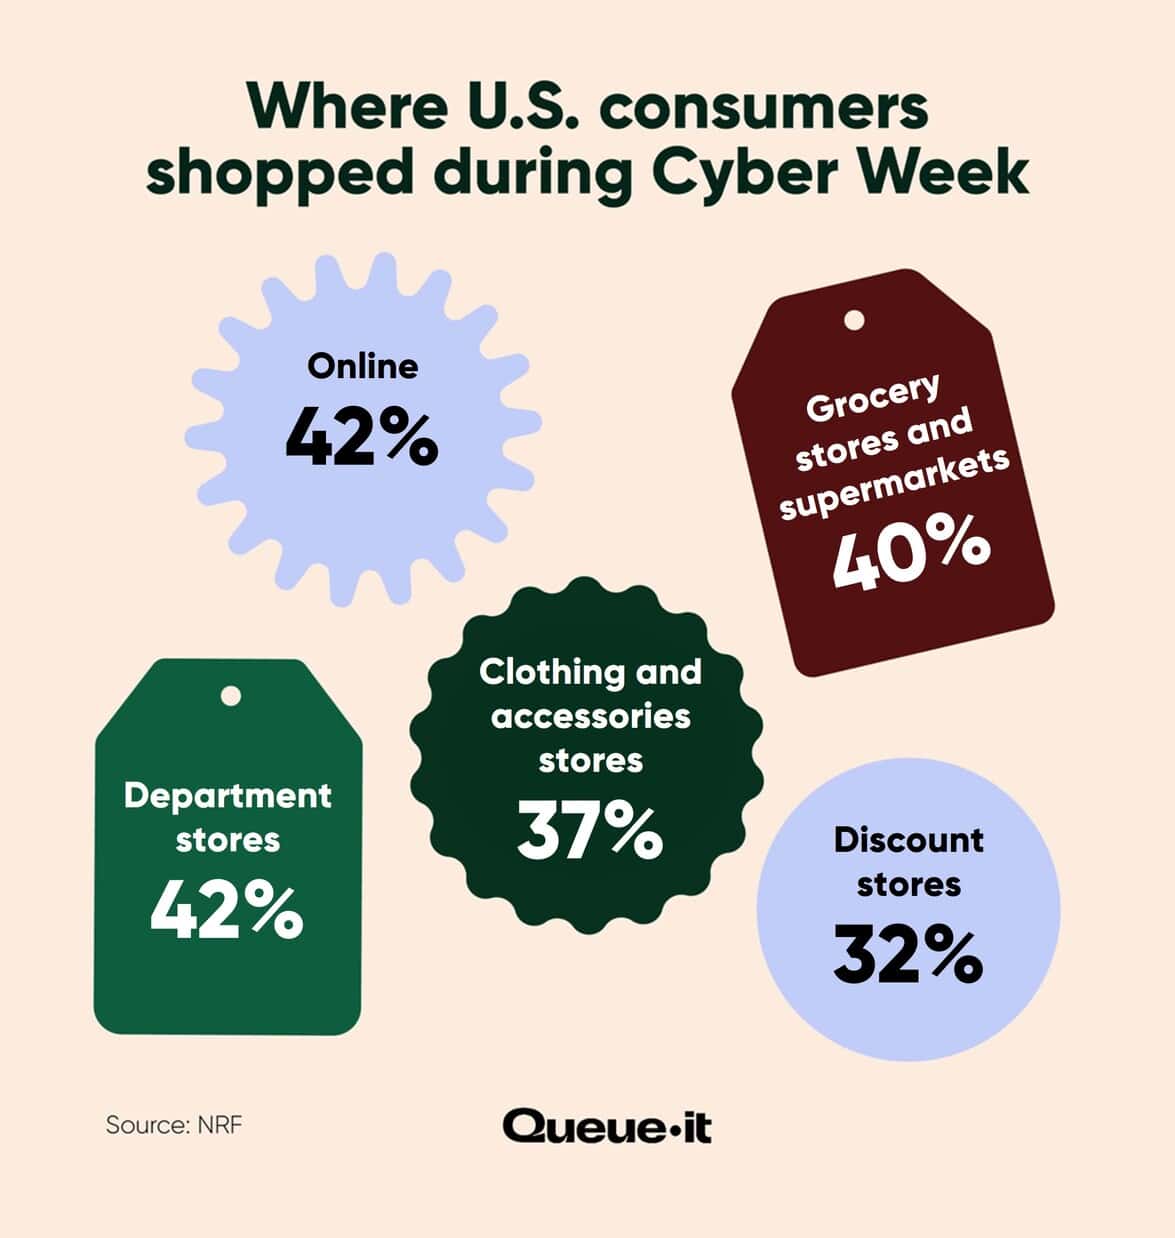
- The top destinations for shopping during Thanksgiving weekend were department stores (42%), online (42%), grocery stores and supermarkets (40%). Clothing and accessories stores (37%), and discount stores (32%).
- 38% of shoppers took advantage of sales before the Thanksgiving Holiday weekend.
- Shoppers reached Cyber Week with approximately 52% of their holiday shopping still to do.
- 27% of U.S. Black Friday shoppers expected to spend less in 2024 than 2023.
- 36% of consumers expected to shop during Black Friday, compared to 34% for Cyber Monday and 32% for Amazon Prime Day.
- 39% of shoppers say they do most of their gift and holiday shopping during big sales days like Black Friday.
- Consumers spent an average of $235 during Thanksgiving weekend.
- Buy Now, Pay Later sales hit an all-time high of $18.2 billion in 2024, up 9.6% YoY.
- AI influenced $60 billion sales.
- Mobile wallet usage increased 16% globally during Cyber Week.
- 34% of consumers say they’ll hold off on making an essential purchase to wait for big sales days.
- On average, holiday budgets were 32% higher in 2024 than in 2023.
- The less than $50k income group plans to spend $829, a 12% increase YoY.
- The $50-99k income group plans to spend $1548, no change YoY.
- The $100-199k income group plans to spend $2546, a 17% increase YoY.
- The $200k+ income group plants to spend $3887, no change YoY.
- The average expected spend on gifts during the 2024 Holiday Season is $536, down 3% YoY.
- The average expected spend on nongifts during the 2024 Holiday Season is $507, up 9% YoY.
- The average expected spend on experiences during the 2024 Holiday Season is $735, up 16% YoY.
Discover how you can break Black Friday sales records without breaking your site

- Black Friday traffic grew 5.3% YoY.
- Black Friday was the biggest day of Cyber Week for ecommerce traffic globally.
- Black Friday traffic was 2x higher than that of a normal October day.
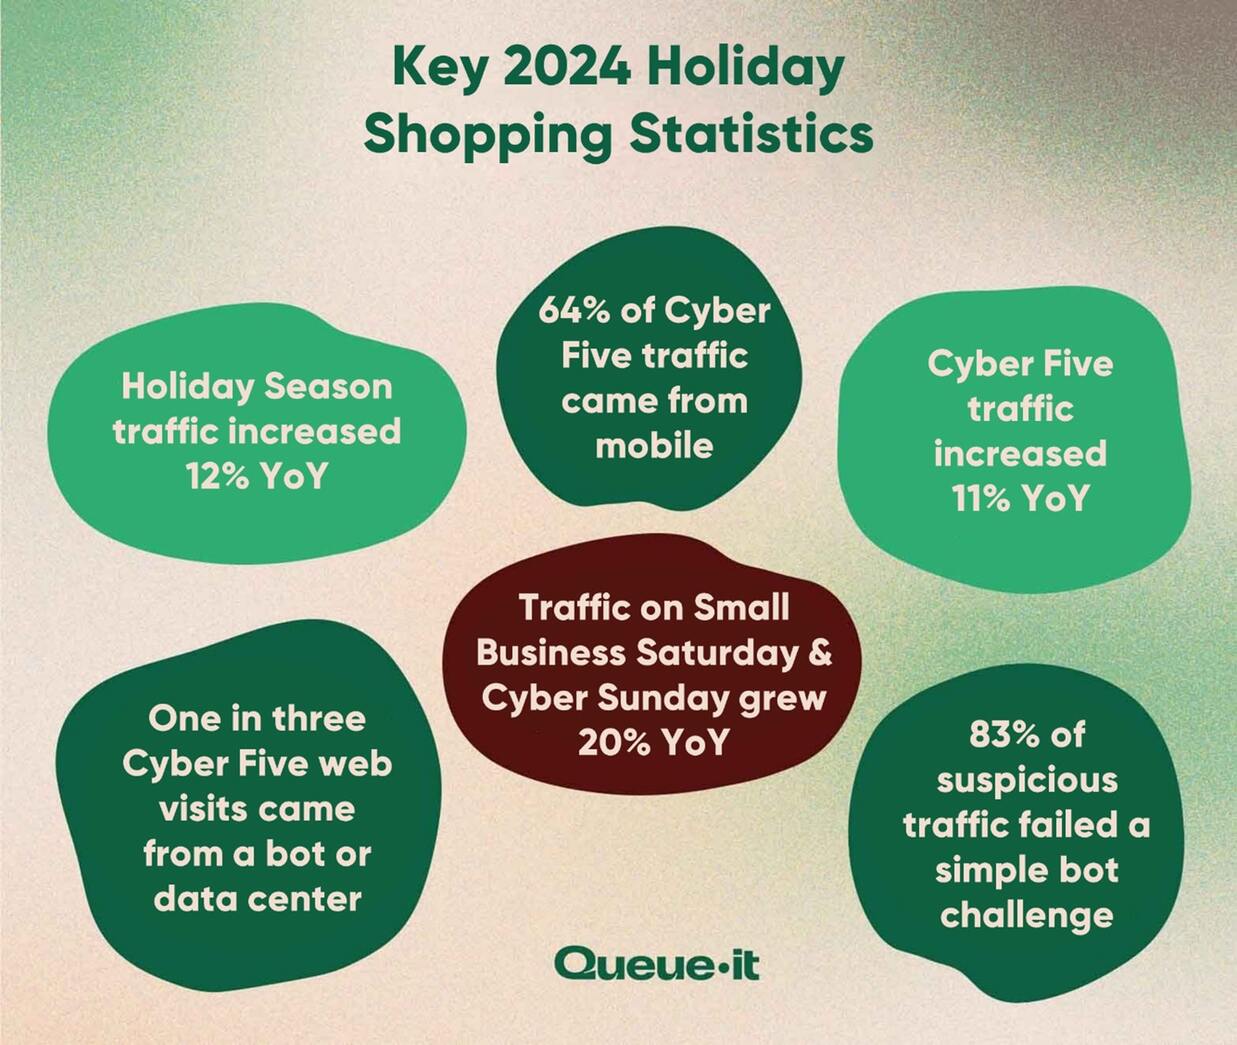
- Holiday Season traffic grew 12% YoY in 2024.
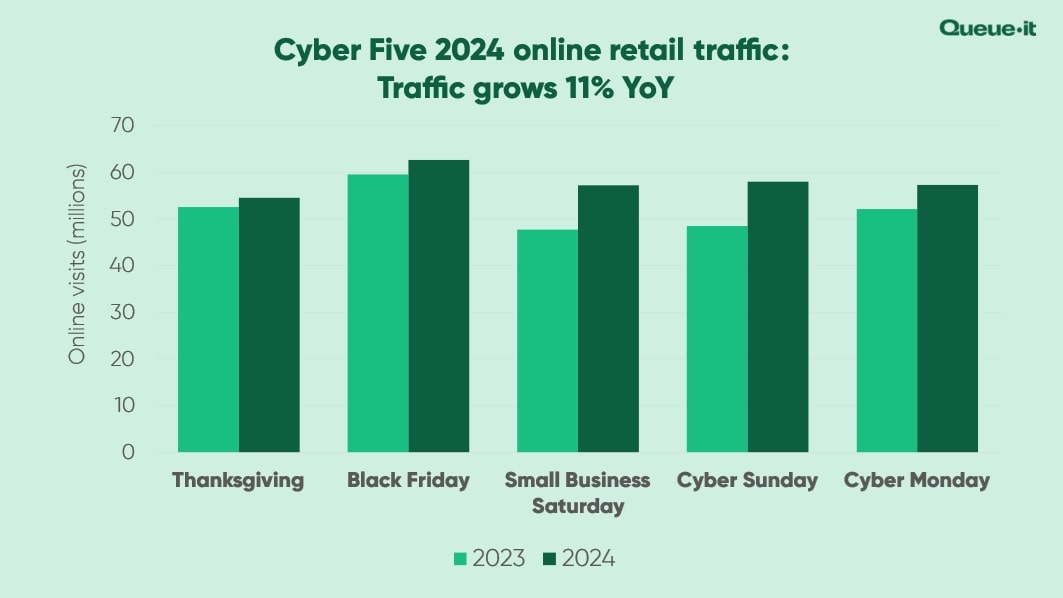
- Cyber Five traffic grew 11% YoY.
- Small Business Saturday and Cyber Sunday had the biggest growth, with 19.8% and 19.7% growth, respectively.
- Electronics was the top category for online traffic, with 60% (1.4 billion web visits) of online visits going to electronics retailers.
- Health and beauty took the no. 2 spot, with 13% of total traffic to those websites.
- Apparel and accessories was no. 3, with 12% of all visitors.
RELATED: 2023 Holiday Shopping Statistics: Data From 2.4 Billion Retail Web Visits
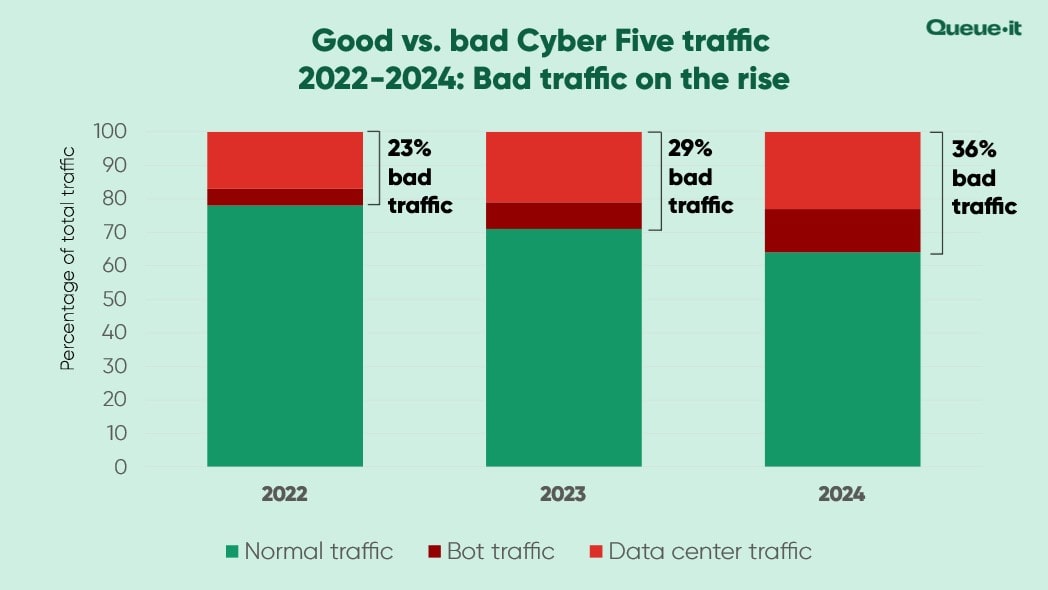
- Bad bot and data center traffic made up 36% of all retail traffic during the Holiday Season, a 24% increase YoY.
- 83% of all visitors presented with a simple CAPTCHA or Proof-of-Work Challenge across the Holiday Season failed to complete it—indicating the bulk of malicious Holiday Season traffic remains relatively unsophisticated.
RELATED: How Currys Used Queue-it to Handle Over 1 Million Black Friday Shoppers
- 64% of all traffic during Cyber Five came from mobile devices, a 12% increase YoY.
- Across the full Holiday Season, 59% of traffic came from mobile devices.
- Desktop traffic dropped to an all time low of 26% in 2024.
Different sources say different things about the exact volume of mobile traffic and sales across Black Friday and Cyber Week. But while the numbers are different, the story is the same, mobile reached new heights in 2024, and isn’t going anywhere:
- 54.5% of all sales were made on mobile devices (up from 51.1% in 2023), with $132 billion in total mobile sales.
- Sales from mobile device during Cyber Week averaged 56.4%.
- Sales from mobile devices peaked on Christmas day, at 65%.
- Mobile devices drove 70% of online orders in 2024.
- Retailers using social commerce strategies saw 19% of sales generated through channels such as TikTok Shop and Instagram.
- More than 80% of Cyber Week traffic came from mobile devices.
- 48% of consumers plan to shop on their smartphone.
RELATED: How to Nurture Loyalty & Optimize Web Performance This Holiday Season [Webinar]
- 66% of consumers say they plan their Black Friday shopping ahead of time.
- Among retailers that offer curbside pickup, 17.5% of online orders made use of that option, down from 18.4% in 2023.
- AI traffic during the Holiday Season grew 13x YoY.
- 66% of consumers are less likely to trust a business after experiencing overselling.
- 64% of consumers are less likely to trust a business after experiencing a website crash.
- 74% of consumers say a reliable website or app is key to driving trust.
- 73% of consumers say transparent online experiences are key to driving trust.
- 68% of consumers are more likely to trust a business that blocks bots & scalpers.
- 87% of consumers prefer a short wait for a website that works over immediate access to a slow or buggy website.
- 84% of consumers prefer an online queue to a crashed website or error page.
- Consumers are willing to wait an average of 53 minutes in an online queue to purchase a limited-inventory product.
- Cyber Monday saw the biggest increase in AI traffic, with a 19x rise YoY.
- 86% of shoppers used Cyber Five to purchase gifts.
- Only 32% of respondents planned to buy self-gifts in 2024 (versus 48% in 2023).
- Four in 10 consumers planned to give experiential gifts in 2024.
- Across all income groups, at least 40% were showing five or more signs of frugal behavior in 2024.
- 68% of respondents plan to shop during Thanksgiving week (versus 66% in 2023); intent to participate is highest among Gen Z and millennials (79%).
- 7 in 10 consumers expected higher prices in 2024 than in 2023.
- 75% planned to shop during at least one promotional event, up from 61% in 2023.
- 62% of consumers said they’d shift brands if the preferred one was too expensive.
- 48% said they’d shop at affordable retailers instead of preferred ones.
- 40% said they would seek out private label products or dupes.
- 80% of retail executives said they expect private label sales to grow faster than national brand sales this Holiday Season.
- 76% of executives believe most consumers will value lower prices over brand loyalty.
- 49% of consumers said they would cut back on self-gifting if their budgets became constrained.
- One in five consumers plans to buy luxury products as gifts for themselves.
- $250 is the average budget for self gifting, with Gen Z consumers self-gifting the most.
- 78% of retail execs say that the rise of retail promotions in early October is pulling the Holiday Season forward.
- 38% of consumers plan to shop during promotional events in October, up from 24% in 2023.
- 13% of consumers plan to buy gifts on social media.
- The three most important qualities for choosing an online retailer are:
- High quality (38%)
- Getting a great deal (37%)
- Variety of products/styles (35%)
- The United Arab Emirates had the highest rate of Black Friday purchase intent, with 54% of shoppers planning to make a purchase.
- Italy ranked no. 2 for purchase intent, with 49% of shoppers planning to make a purchase.
- Australia and Spain were tied for third place, both with 44% of shoppers planning to make a purchase on Black Friday.
- Only 29% of French consumers planned to shop on Black Friday 2024.
- The average German Black Friday budget in 2024 was 317 euros.
- The average Austrian Black Friday budget in 2024 was 303 euros.
- The average Spanish Black Friday budget in 2024 was 282 euros.
- The average French Black Friday budget in 2024 was 265 euros.
- The average Italian Black Friday budget in 2024 was 264 euros.
- The average planned spend for Black Friday/Cyber Monday sales in Great Britain for men was 132 GBP.
- The average planned spend for Black Friday/Cyber Monday sales in Great Britain for women was 112 GBP.
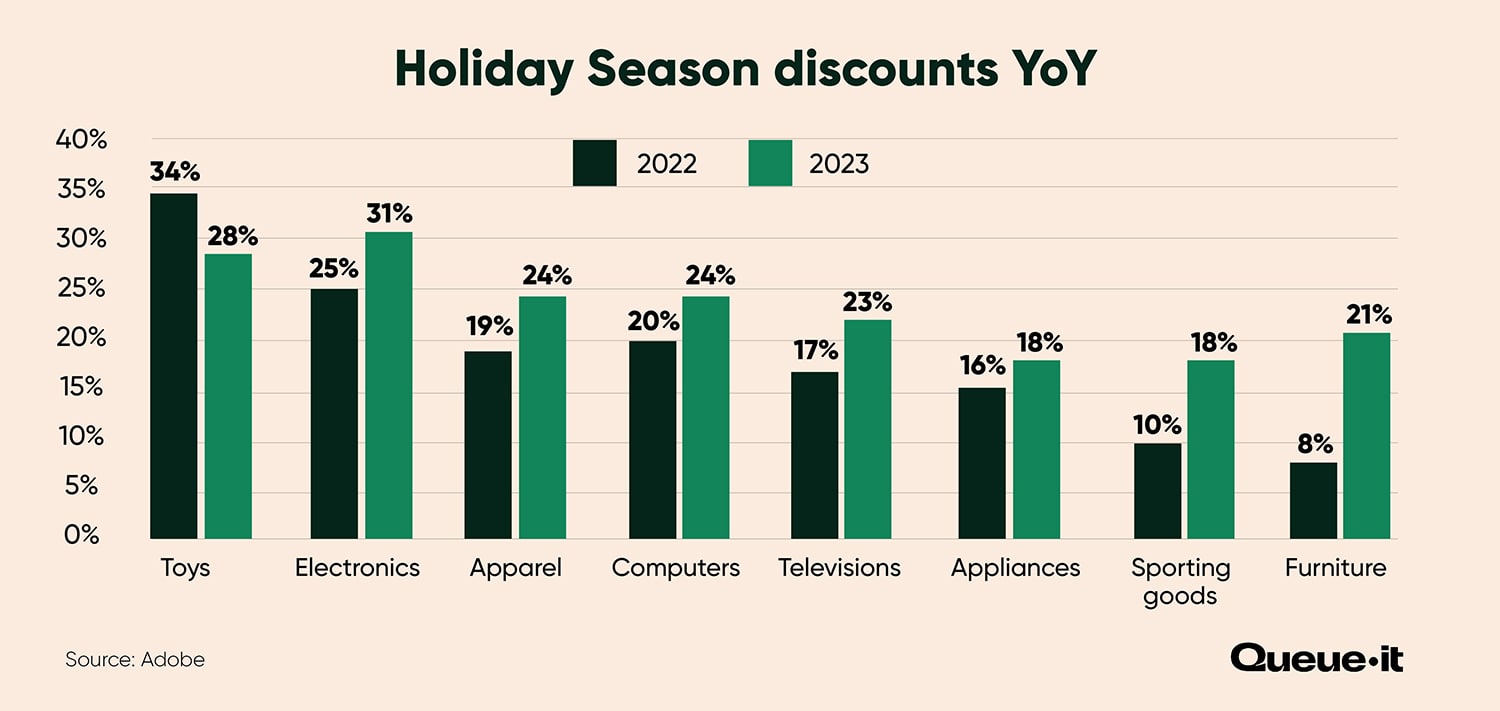
- The global average discount rate was 26%.
- Makeup had the highest average discount rate, at 40%.
- The return rate reached 10.3%, up from 7.9% last year.
- Returns peaked the week before Christmas and Boxing Day at 17.7%, up 10% YoY.
- GMV generated from social commerce platforms increased by 15% YoY.
- Use of buy now, pay later (BNPL) grew 10% YoY.
- Electronics drove $55.3 billion in sales, up 8.8% YoY.
- Apparel drove $45.6 billion in sales, up 9.9% YoY.
- Furniture/home goods drove $29.2 billion in sales, up 6.8% YoY.
- Cosmetics drove $7.7 billion in sales, up 12.2% YoY.
- Toys drove $8.2 billion in sales, up 7.8% YoY.
- The top products purchased as gifts were clothing and accessories, which were bought by 49% of consumers.
- The second most popular products purchased as gifts were toys, which were bought by 31% of consumers.
- The third most popular gift category was gift cards, bough by 27% of consumers.
- The fourth and fifth most popular product categories were food and candy (27%) and personal care of beauty items (23%).
- Adobe expects Black Friday 2025 online sales to grow by 8.3%, reaching $11.7 billion in the U.S.
- Full Holiday Season sales are expected to reach $253 billion, 5.3% growth YoY.
- Cyber Week is expected to drive 17.2% of total spend, at $43.7 billion.
- Cyber Monday is expected to grow 6.3% to reach $14.2 billion.
- Mobile traffic is expected to drive a record 56% of online spend, or $142 billion.
- Buy Now Pay Later is expected to drive $20 billion in online spend, up 11% YoY.
- Discounts are expected to average 28%, on par with 2024.
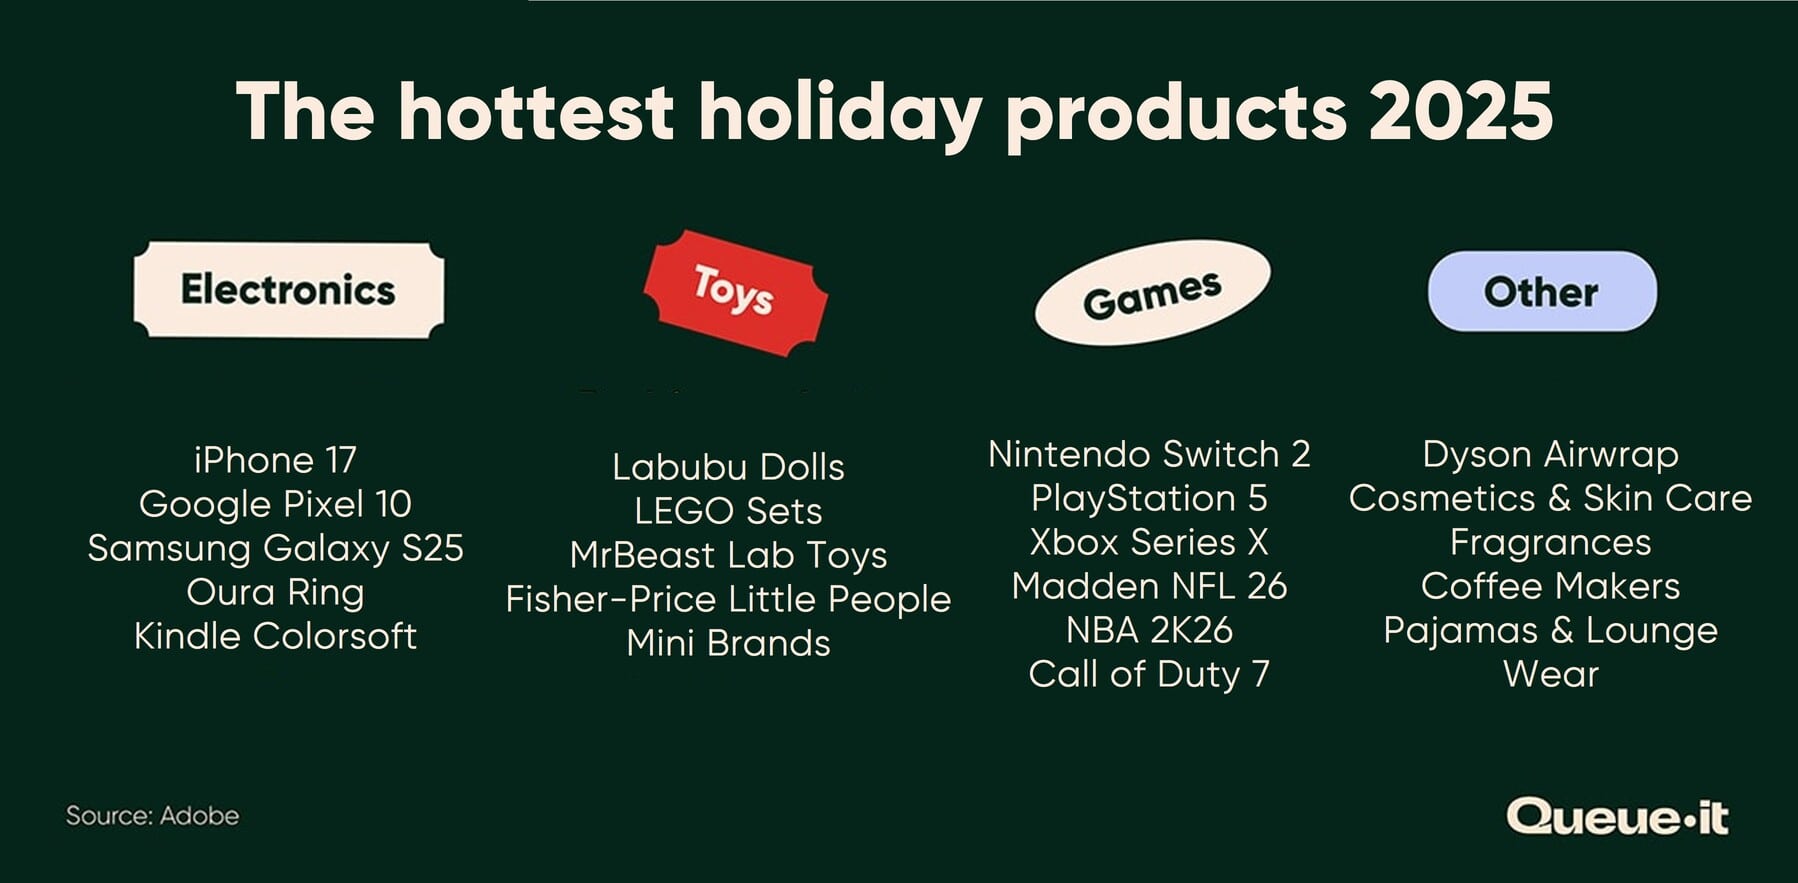
- Hot products for 2025 are expected to include gaming consoles and video games, toys, mobile devices, and home tech.
- AI-driven traffic is expected to rise 520% in the 2025 Holiday Season.
- The share of online revenue attributed to social media platforms is also expected to rise by 51%.
- Consumers expect seasonal spending to decline by 5% YoY in 2025, the first notable drop since 2020.
- 84% of consumers expect to cut spending over the next six months, attributing this to rising prices, tariffs, and higher cost of living.
- Gen Z consumers expect to cut spending by 23%, more than any other generation.
- 78% of consumers are seeking less expensive alternatives.
- For the first time, holiday shopping is nearing channel parity, with 51% planning to shop on online marketplaces, and 53% planning to shop in person.
- In 2025, 39% of the total planned holiday spending will happen across Cyber Week.
- 80% of all planned holiday gift spending will occur by the end of Cyber Monday.
- Average expected holiday spend for 2025 is $1595, a 10% drop YoY.
- 70% of consumers are engaging in three or more deal-seeking activities in 2025.
- 33% of shoppers plan to use generative AI in their shopping journey.
- 1 in 5 plan to start shopping earlier in 2025 than 2024.
- 40% plan to shop during October promotional events.
- 70% of shoppers plan to shop during Cyber Week 2025.
- 68% of shoppers plan to use digital tools for holiday shopping.
- Consumers plan to spend 56% of their holiday budget online, and 44% in store.
- 58% say they think holiday gift shopping is stressful, and 77% say they usually feel frustrated while shopping online.
- 50% of holiday shoppers plan to spend most of their budget online or at mass merchant retailers.
- 26% plan to use loyalty points for holiday shopping.
- 47% of consumers plan to give experiential gifts in 2025.
- 87% of shoppers plan to spend the same or more in 2025.
- 76% of consumers say they’re overwhelmed by too many product choices.
- 66% of consumers have used generative AI in the last three months, up from 39% in 2024.
- 70% of retailers plan to hire more frontline workers in 2025 compared to 2024.
- Cyber Week (also known as Cyber Five or Thanksgiving weekend) describes the five days from Thanksgiving in the U.S. (Thursday), through to Cyber Monday. It’s made up of Thanksgiving, Black Friday, Small Business Saturday, Sunday (which doesn’t have a name), and Cyber Monday.
- The Holiday Season shopping period is generally defined as the period from Nov. 1 through to Dec. 31.
- The statistics in this article come from a wide range of sources including (but not limited to) Adobe Analytics, Salesforce, Mastercard, the National Retail Federation, and Queue-it. Each of these organizations has different data sources, so exact numbers may differ in some instances.